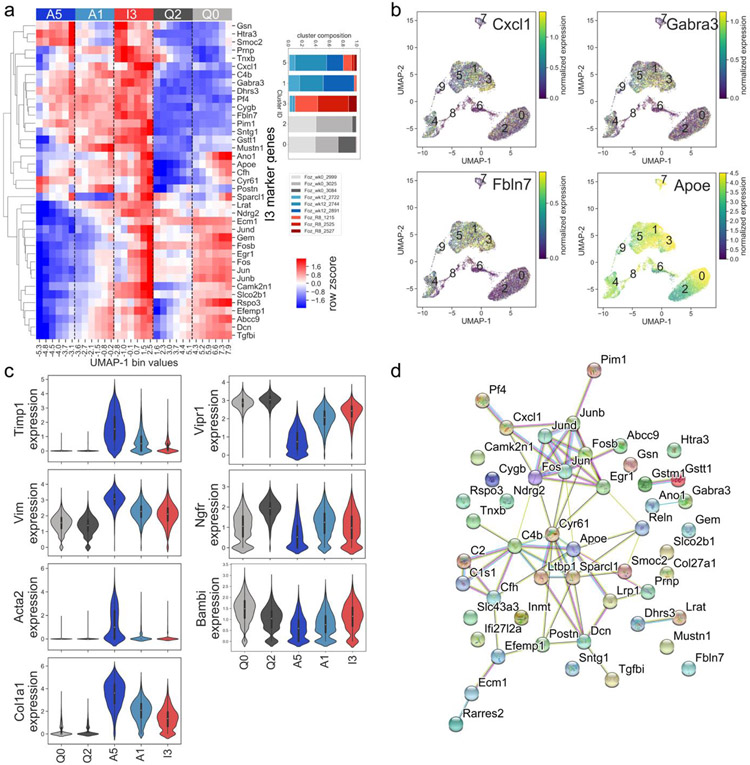
Figure 6: Characterization of inactivated HSCs in murine NASH.
a) Heatmap displays relative gene expression in cells binned by UMAP dimension 1, for cells in clusters A5, A1 (activated), I3 (inactivated), Q0, and Q2 (quiescent), bins evenly spaced between minimum and maximum UMAP-1 value for cells in clusters A5, A1, I3, Q0, and Q2. Relative expression for top 40 I3 marker genes for each cluster is shown. Expression levels of cells in the A1 cluster are intermediate between A5 and I3. Relative expression for top 15 marker genes for each cluster is shown. Cluster membership annotated by top color bar and dotted line. Inset indicates breakdown of cells in A5, A1, I3, Q0, and Q2 by sample. b) Individual cell expression of selected I3 marker genes. c) Violin plots demonstrating cluster-specific expression of selected marker genes in quiescent, activated, and inactivated clusters. d) Molecular interactions among cluster I3 marker genes, from the STRING database. This gene set has more interactions than expected by chance (p<1E-16, permutation test).

