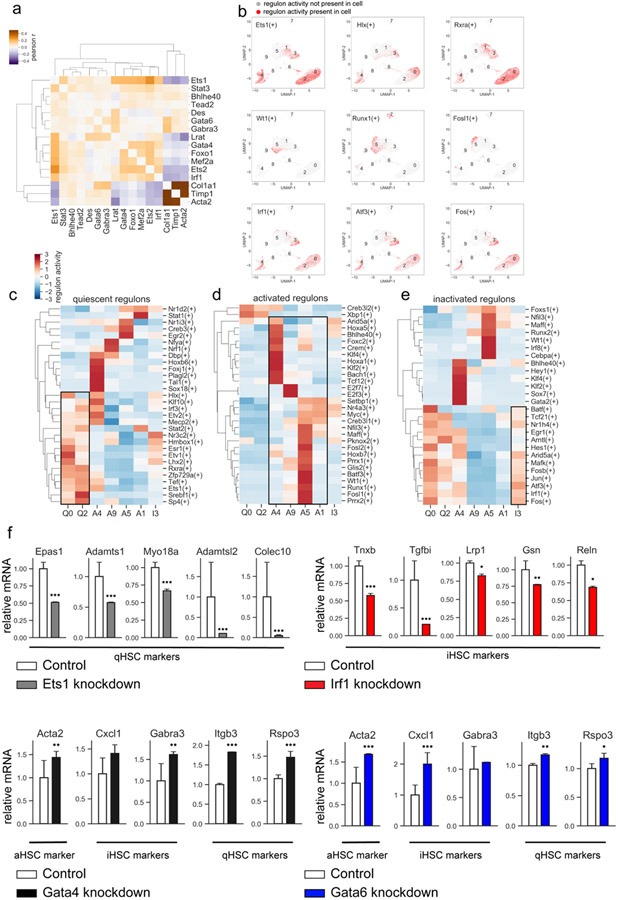
Figure 8: Analysis of transcription factors.
a) Heatmap displaying the correlation in expression (Pearson r) between selected transcription factors and selected markers of stellate cell activation. b) Top row: regulon activity of selected quiescent transcription factors, middle row: regulon activity of selected activated transcription factors, bottom row: regulon activity of selected inactivated transcription factors. c-e) Relative regulon activity per cluster for quiescent (c), activated (d), or inactivated (e) regulons. f) Primary HSCs (1 x 10⁶ cells) were infected with TF-specific shRNA- or non-targeting lentiviruses (>2 targeted and control vectors were tested), followed by ± puromycin (5μg/ml) and analyzed by RNA-Seq. Selected quiescent HSC marker genes observed to be downregulated upon knockdown of Ets1 (top left), selected inactivated HSC marker genes observed to be downregulated upon Irf1 knockdown (top right), selected markers of activated, inactivated, and quiescent HSCs observed to be significantly upregulated upon knockdown of Gata4 (bottom left) or Gata6 (bottom right). Relative expression normalized to mean of control mice. Error bars indicate 1 standard deviation. *p <0.05, **p <0.01, ***p <0.001, adjusted p-value from DESeq2 analysis of RNAseq data.

