
Fig. 2. Longitudinal antibody neutralizing capacity.
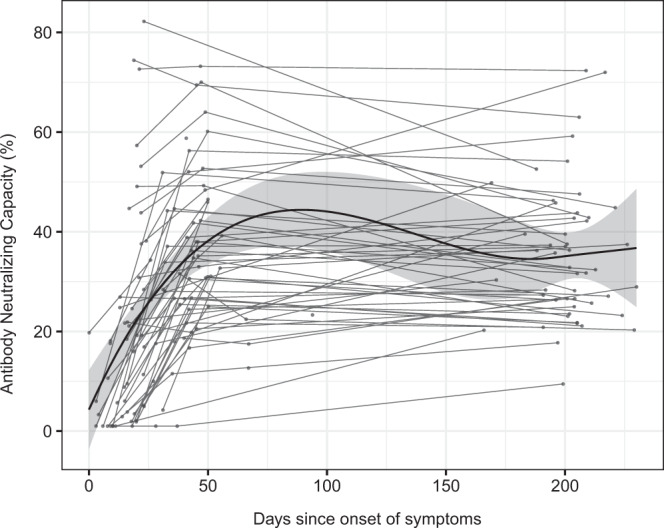
Antibody neutralizing capacity, as a percentage of RBD-ACE2 binding inhibition in plasma samples from 64 symptomatic participants collected in three serial visits (M0, M1, and M6) represented as days after symptom onset. Paired samples are joined by gray lines. The black solid line represents the fitted curve calculated using the LOESS (locally estimated scatterplot smoothing) method. Shaded areas represent 95% confidence intervals.