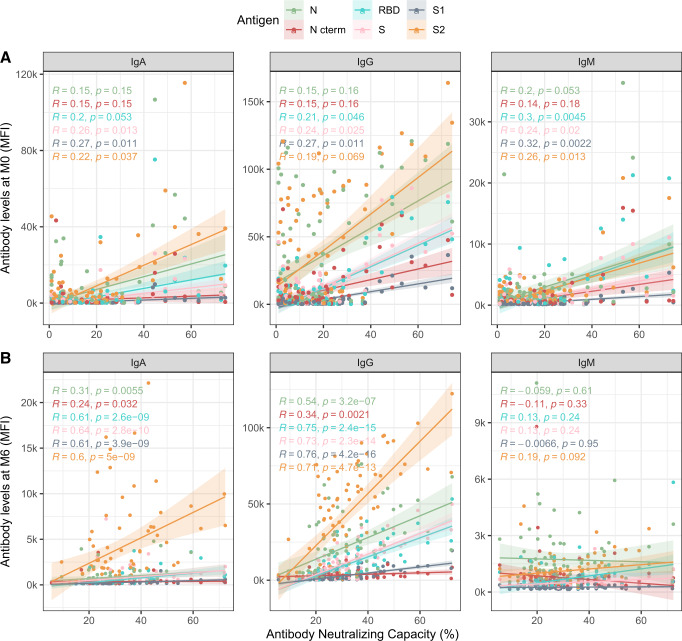
Fig. 3. Correlations between antibody levels and RBD-ACE2 neutralization capacity.
Spearman’s rank correlation test between levels (median fluorescence intensity, MFI) of IgA, IgG, and IgM against each antigen (Nucleocapsid full-length protein (N), and its C-terminal domain, the Receptor Binding Domain (RBD), full S protein and its subregions S1 and S2) at A baseline visit (M0) and B M6 visit; and plasma neutralization capacity (as a percentage of RBD-ACE2 binding inhibition). Two-sided spearman test was used to calculate the p-values and rs correlation coefficients are color-coded for each antigen/isotype pair. Colored lines represent the fitted curve calculated using the linear model method. Shaded areas represent 95% confidence intervals.

