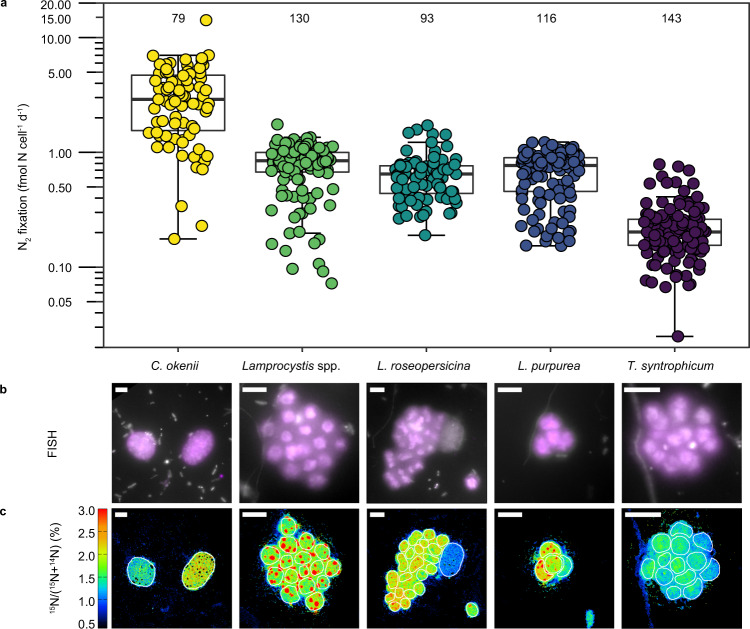
Fig. 4. Single cell N2 fixation activity determined by nanoSIMS.
a Single-cell N2 fixation rates of individual PSB populations in 13.7 m water depth. The number of cells analyzed per population (n) is shown above each box plot. Boxplots depict the 25–75% quantile range, with the centerline depicting the median (50% quantile); whiskers encompass data points within 1.5× of the interquartile range. Y-axis is in log scale. b Representative epifluorescence and c nanoSIMS images of the individual PSB populations. Scale bars (b and c) represent 4 µm. Individual target PSB populations (in purple) were identified using specific FISH probes. All cells were counterstained with DAPI (white). PSB in nanoSIMS images are outlined in white. Note the presence of one C. okenii cell in the L. roseopersicina images. For each population, four independent FISH experiments were conducted, with similar results as shown in panel (b).

