
Fig. 5. Total N2 fixation rates of investigated PSB in comparison to bulk N2 fixation rate in 13.7 m water depth.
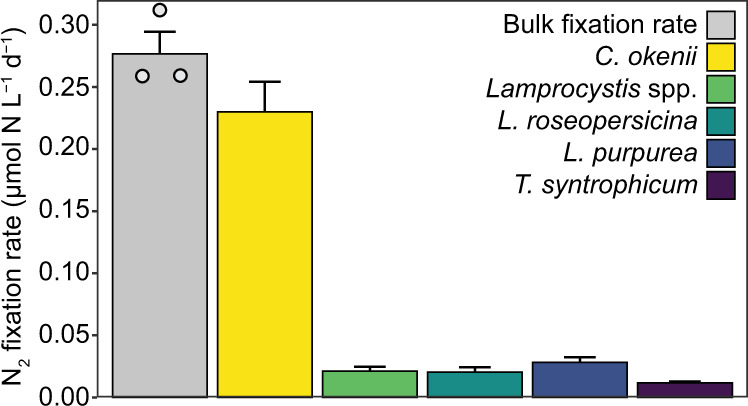
The bulk rate is shown as the average of the triplicate incubations, with the error bar representing the standard deviation. Gray circles represent the individual replicates. Population-specific rates were calculated based on the average cell abundance and average single-cell N2 fixation rate. Here, error bars represent the propagated standard error of the cell abundance and the single-cell N2 fixation rate.