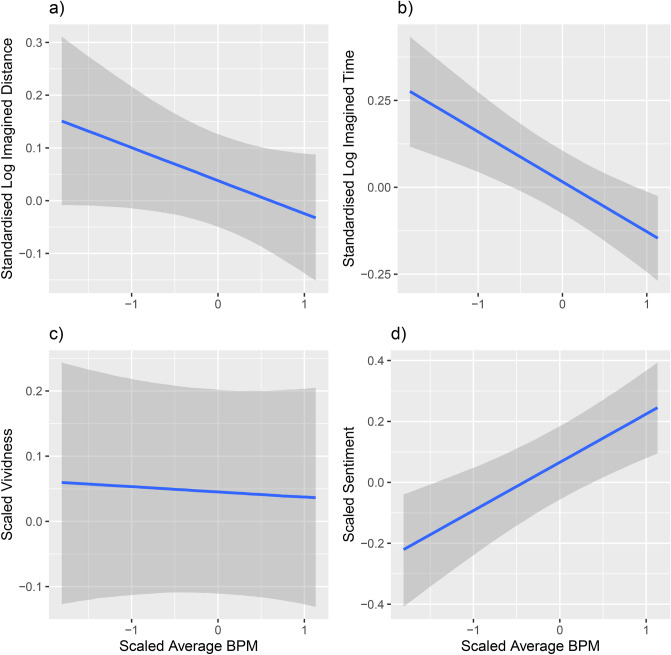
Figure 5.
Standardised Log Imagined Distance (a) and time (b), as well as normalised vividness (c) and sentiment (d) as a function of scaled Average BPM. Higher BPM predicts lower imagined distance and time, as well as more positive sentiment of the imagined content. Vividness, however, is not predicted by BPM of the auditory inducers. Error bars show 95% CIs, note that a lot of the variability visible in this plot is accounted for in the models by the random effect structure.

