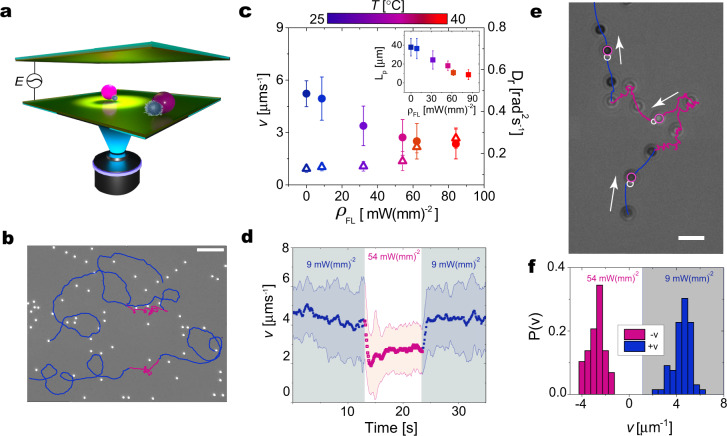
Fig. 2. Experimental realization of adaptive active dumbbells.
a Schematic representation of the experimental cell, illustrating the transverse AC electric field E and the local illumination with fluorescent light, respectively generating motion and causing particle reconfiguration. b Examples of particle trajectories switching ρFL between 9 (blue trajectory) and 54 mW(mm)−2 (magenta trajectory). At ρFL = 54 mW(mm)−2, the PS particle heats the microgel above its volume phase transition temperature (VPTT), causing a motility change. c v (solid circles) and Dr (open triangles) as a function of illumination power density ρFL. The inset represents the persistence length (Lp) of the particles' trajectories as a function of ρFL. The color scale represents the corresponding temperatures. d Particle velocity as a function of time for two levels of illumination ρFL = 9 (shaded areas) and 54 (white area) mW(mm)−2. Scale bar represents 20 μm. e Particle trajectory (×63 magnification) showing that at ρFL = 9 mW(mm)−2 (blue) the particle swims toward the PS lobe (+v), and at ρFL = 54 mW(mm)−2 (magenta) it changes direction and swims with the microgel in front (−v). The pink and white circles indicate the position of the PS particle and microgel, respectively. f Histogram of particle velocity (45 particles) at low ρFL (9 mW(mm)−2−gray area) and high ρFL (54 mW(mm)−2−white area). Error bars in all cases indicate the standard deviation of the data.

