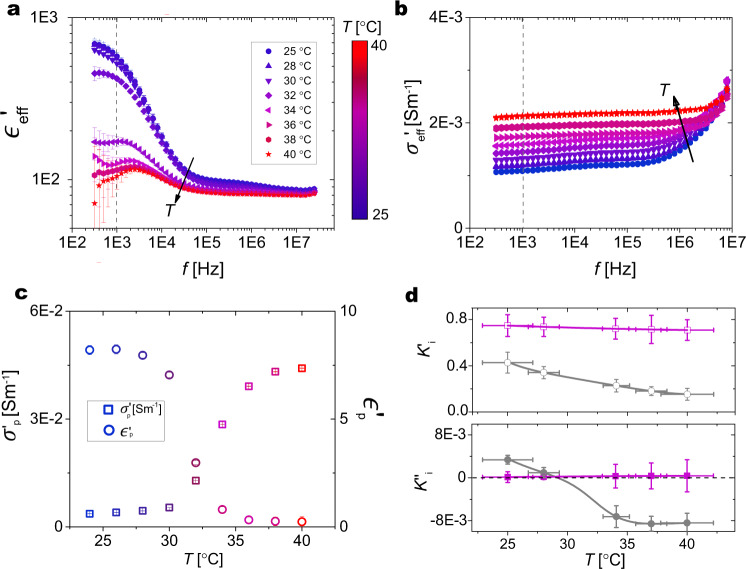
Fig. 3. Dielectric spectroscopy measurements.
a and b as a function of frequency f for an aqueous suspension of microgels (1 wt %) measured for T between 22 and 40 °C. The data are corrected to remove electrode polarization. c Permitivitty (, open circles) and conductivity (, open squares) vs. T at f = 1 kHz. d Real ( top, open symbols) and imaginary part (K″ bottom, solid symbols) of the Claussius–Mossotti factor for each particle i, i.e., microgels (gray) and PS particles (pink). The values are obtained for each particle from Eq. (2), using the corresponding values of and . The error bars indicate the standard deviation of the data.

