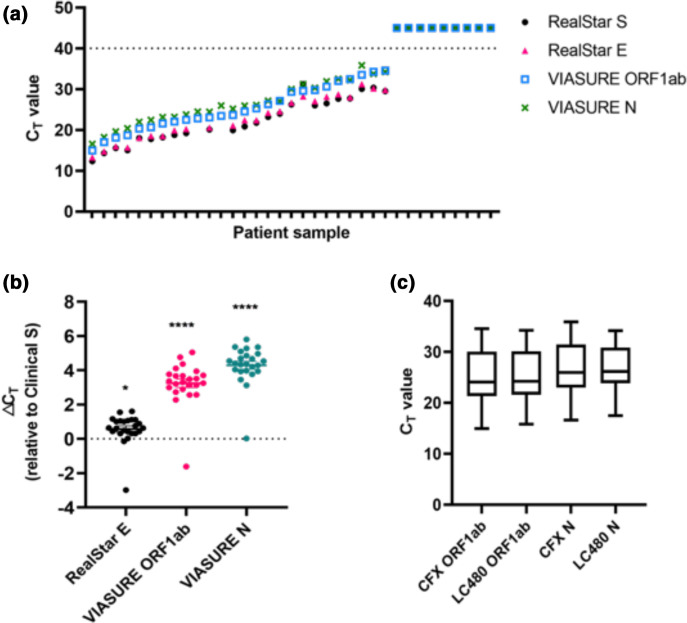
Fig. 1.
Comparison of VIASURE and RealStar kits using RNA (a) CT values generated from VIASURE ORF1ab and N gene probes and RealStar S and E probes. Individual points represent a single detected SARS-CoV-2 sample. Samples with CT values above the dotted line are interpreted as negative. (b) △CT for each sample was calculated relative to RealStar S CT value to demonstrate differential probe sensitivity. Statistical differences for each gene were calculated using a one-way ANOVA with Dunnett’s multiple comparison post-hoc test comparing to clinical S (*P ≤0.05, ****P ≤0.0001). (c) Comparison of median and interquartile range for CT values obtained using the VIASURE assay on two RT-qPCR machines, Bio-Rad CFX and Roche LC480 with no significant differences found between comparisons. (n=26).

