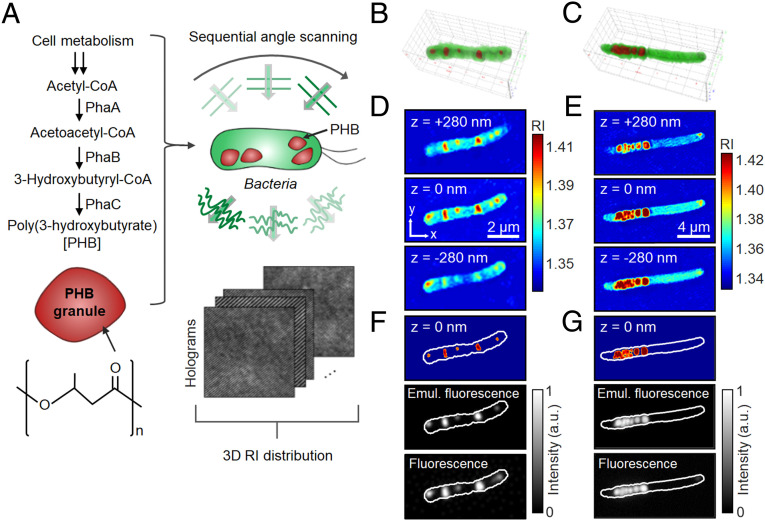
Fig. 1.
ODT analysis for bacterial cells accumulating PHB. (A) Schematic illustration of the ODT analysis. PHB biosynthesis pathway and the chemical structure (Left). Two-dimensional holograms of a bacterial cell are recorded at various illumination angles to reconstruct the 3D RI distribution of the cell (Right). (B and C) 3D-rendered images of the reconstructed RI distribution of C. necator and recombinant E. coli cells, respectively. (D and E) Cross-sectional images of the corresponding 3D RI distributions. (F and G) PHB identification based on the RI threshold (RI > 1.39) (Top), emulated fluorescence-like images obtained by 3D convolution-based imaging processing (Middle), and wide-field fluorescence images of Nile Red–stained cells (Bottom).

