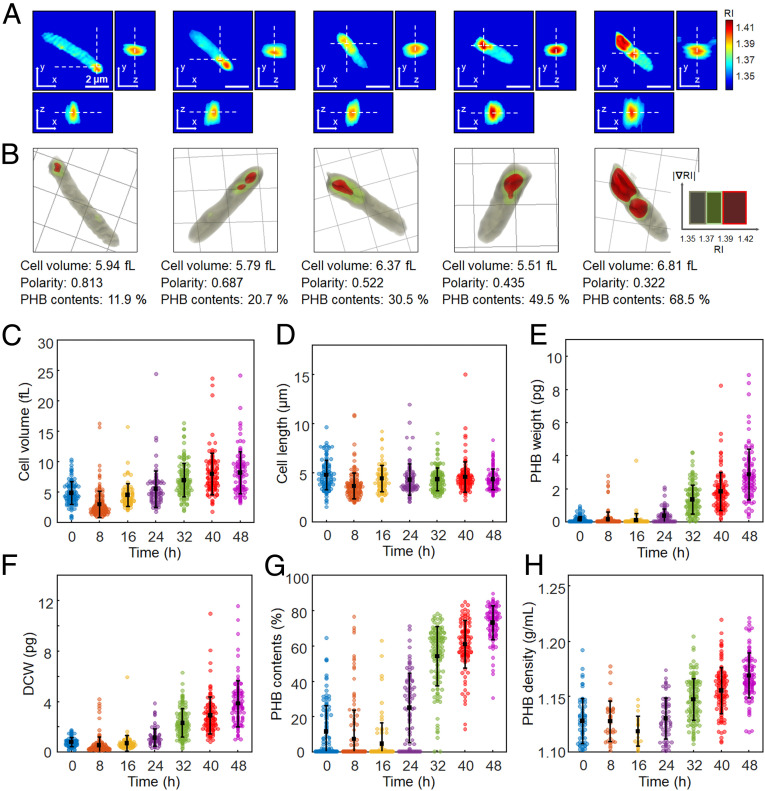
Fig. 3.
Quantification of individual recombinant E. coli cells accumulating PHB granules. (A) Representative 3D RI tomograms at selected x-y, y-z, and z-x planes and (B) 3D rendering images of E. coli cells with different levels of PHB accumulation. One grid equals 2 μm. The quantified cell volume, polarity, and PHB content (%, wt/wt) are noted below the rendering images. (C) Cell volume (fL). (D) Cell length (μm). (E) PHB granule weight (pg). (F) DCW (pg). (G) PHB content (%, wt/wt). (H) PHB granule density (g/mL). The bars indicate averages and SDs. The numbers of analyzed cells are 112, 151, 87, 85, 135, 108, and 103 for 0, 8, 16, 24, 32, 40, and 48 h, respectively.

