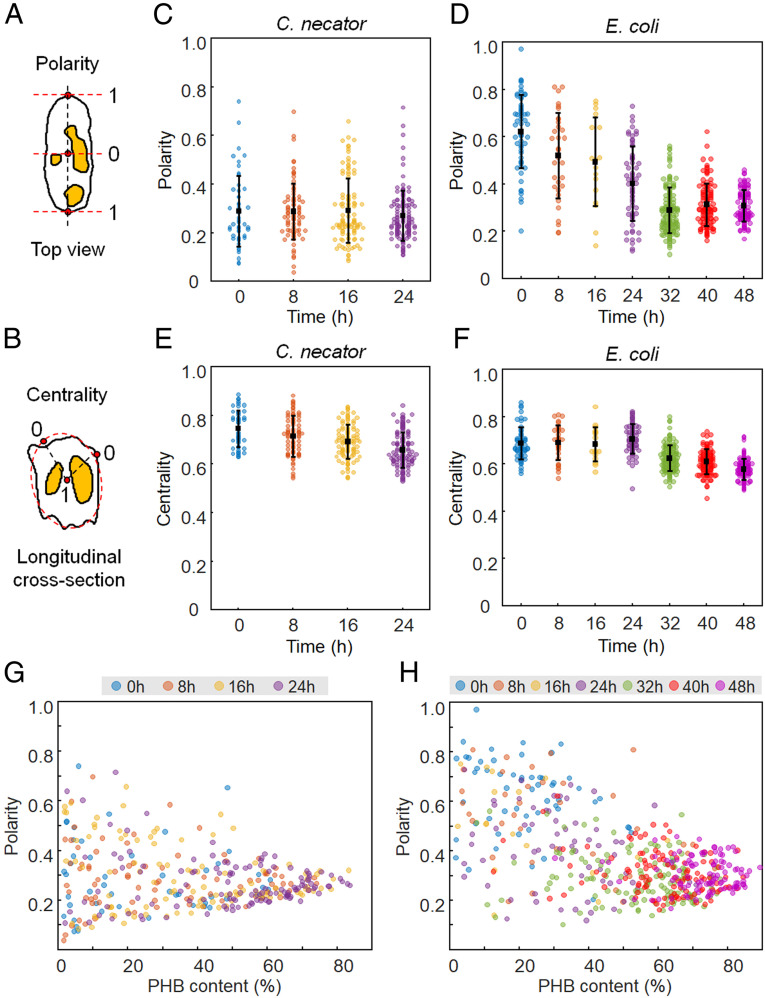
Fig. 5.
In vivo localization of PHB granules. Diagrams for calculation of (A) polarity and (B) centrality. PHB granules are indicated in yellow. (C and D) Polarity distributions of C. necator and recombinant E. coli cells, respectively. (E and F) Centrality distributions of C. necator and recombinant E. coli cells, respectively. (G and H) Scatter plots of polarity versus PHB content (%, wt/wt) for C. necator and recombinant E. coli cells, respectively.

