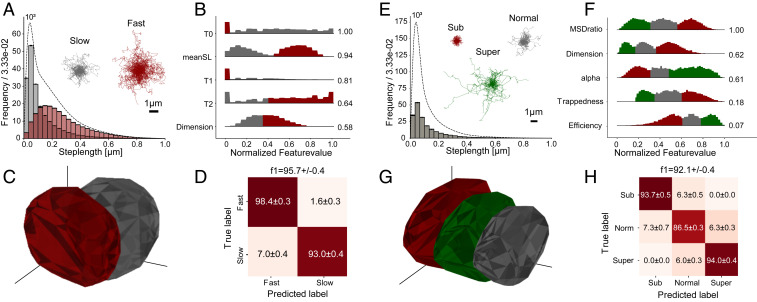
Fig. 2.
Feature ranking and machine-learning prediction for data were simulated using a four-state diffusion model with two different HMM occupation probabilities (A–D) and again using the same HMM occupation probabilities but with three different persistences of motion: HMM diffusion with subdiffusive states (), HMM diffusion with normal diffusion states (), and HMM diffusion with superdiffusive states () (E–H) (see SI Appendix for simulation method). (A and E) Histogram of step lengths for each variant and distribution for the entire dataset (dotted line). The overlaid trajectories are 100 randomly chosen traces for each variant. The scale bar is the same for both groups of traces (n = 10,000 for A and n = 15,000 for E). (B and F) Normalized distribution of the four most descriptive features in the diffusional fingerprint based on a ranking of components in a one-dimensional LDA projection (numbers to the right). Histogram bins are colored based on the variant with highest value for that bin. (C and G) Three-dimensional PCA projection of the data with convex hull polygons surrounding 1 of the data points from the mean for each variant. (D and H) Confusion matrix for prediction with a logistic regression model trained to separate the fingerprints. The uncertainty is obtained from a stratified fivefold cross-validation with prediction on 20% of the data and training on 80%.

