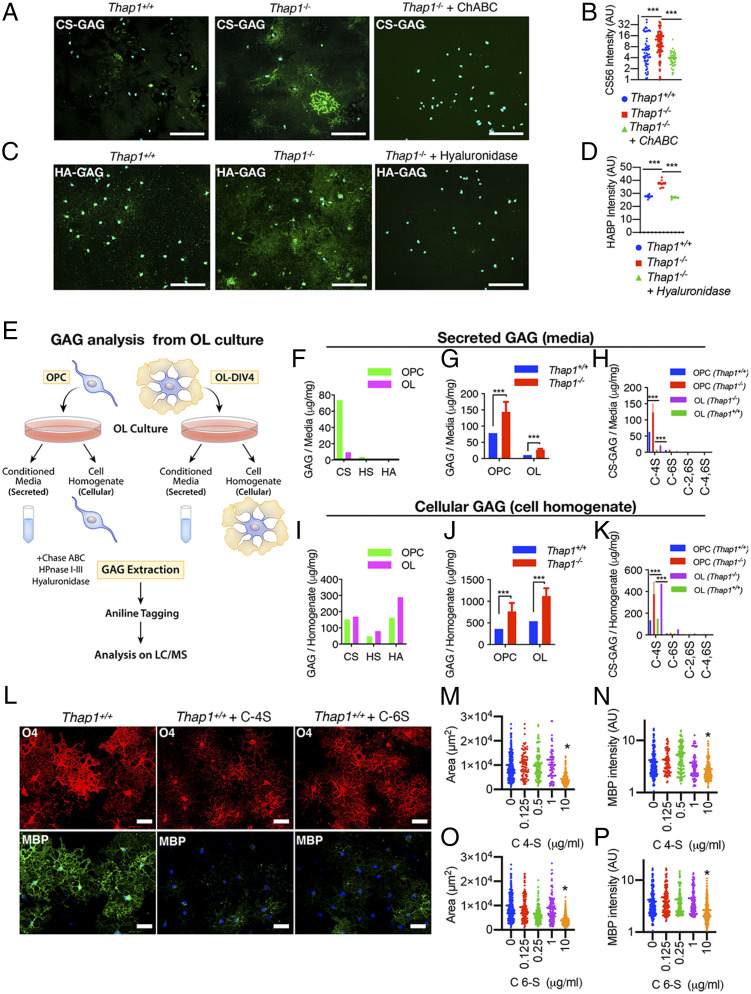
Fig. 2.
Thap1 null OLs accumulate and secrete excess GAGs. (A–D) Representative images and the corresponding quantification for Thap1+/+ and Thap1−/− OL cells (DIV4) immunostained with CS-56 (CS-GAG) (A and B), and biotinylated hospital-acquired bacterial pneumonia (HA-GAG) (C and D) under nonpermeabilizing conditions. Thap1−/− OL exhibit a significant accumulation of CS-GAG (Thap1+/+ = 6.68 ± 1.13; Thap1−/− = 12.60 ± 1.29; Thap1−/− + ChABC = 3.93 ± 0.286; and one-way ANOVA F(2,205) = 14.59, P < 0.0001, Dunnett’s multiple comparisons test: adjusted P value < 0.0001); n = 2 clonal lines (50 cells per clone) per genotype and HA-GAG (Thap1+/+ = 27.64 arbitrary units [AU] ± 0.38; Thap1−/− = 37.45 AU ± 2.68; Thap1−/− + hyaluronidase = 26.77 AU ± 1.16; and one-way ANOVA F(2,21) = 75.59, P < 0.0001, Dunnett’s multiple comparisons test: adjusted P value = 0.0004 and < 0.0001); and n = 2 clonal lines (10 images per clone). (E) Schematic illustrating the study design for mass spectrometry analyses of CS, HS, and HA GAGs using GRIL LC/MS analysis. (F and I) Total CS, HS, and HA GAGs (microgram/milligram/mg) secreted in the media (F) or from cell homogenate Thap1+/+ OPC and OL (I) (see SI Appendix, Fig. S2 C and D for GAG content). (G, H, J, and K) Abnormal accumulation of GAGs in Thap1−/− cultures (n = 2 independent clonal lines simultaneously isolated and processed). (G and J) Total GAGs (microgram/milligram) (CS, HA, and HA-GAGs combined) secreted in the media (G) or from cell homogenate from Thap1+/+ and Thap1−/− OPC and OL (J) (see SI Appendix, Fig. S2 C and D for GAG content). (H and K) CS-GAGs (microgram/milligram) and the composition of mono (C-4S and C-6S) and bisulfated (C-2,6S and C-4,6S) CS-GAGs secreted in the media (H) or from cell homogenate from Thap1+/+ and Thap1−/− OPC and OL (K) (see SI Appendix, Fig. S2 E and F for GAG content). (L–P) C-4S and C-6S inhibit OL differentiation. (L–P) Representative images (L) and corresponding quantification (M–P) of differentiated wild-type OPC without (L, Left column) or with C-4S (10 μg/mL; Middle column) or C-6S (10 μg/mL; Right column) GAG applied to the culture media from DIV2 to DIV5 (scale bar, 50 μm.) (M and O) Area (square micrometer; y-axis) of O4-stained OL at DIV5 for differentiated wild-type OPC treated with C-4S or C-6S DIV2 to DIV5 (0 to 10 μg/mL; x-axis); >250 cells from five different images were quantified for each condition. One-way ANOVA C-4S = F(4,545) = 24.554, P < 0.0001; C-6S = F(4,776) = 43.31, P < 0.0001; and Dunnett’s multiple comparisons test: adjusted P value = < 0.0001). Each data point in the scatter plot represents the area measured for individual cells. (N and P) Mean intensity of MBP staining (AU; y-axis) at DIV5 normalized to background for wild-type OPC treated with C-4S or C-6S (0 to 10 μg/mL; x-axis). One-way ANOVA C-4S = F(2,687) = 13.61, P < 0.0001; and C-6S = F(4,919) = 12.41, P < 0.0001 Dunnett’s multiple comparisons test: adjusted P value = 0.0004 and < 0.0001. Each data point in the scatter plot represents MBP+ staining intensity for individual cells.

