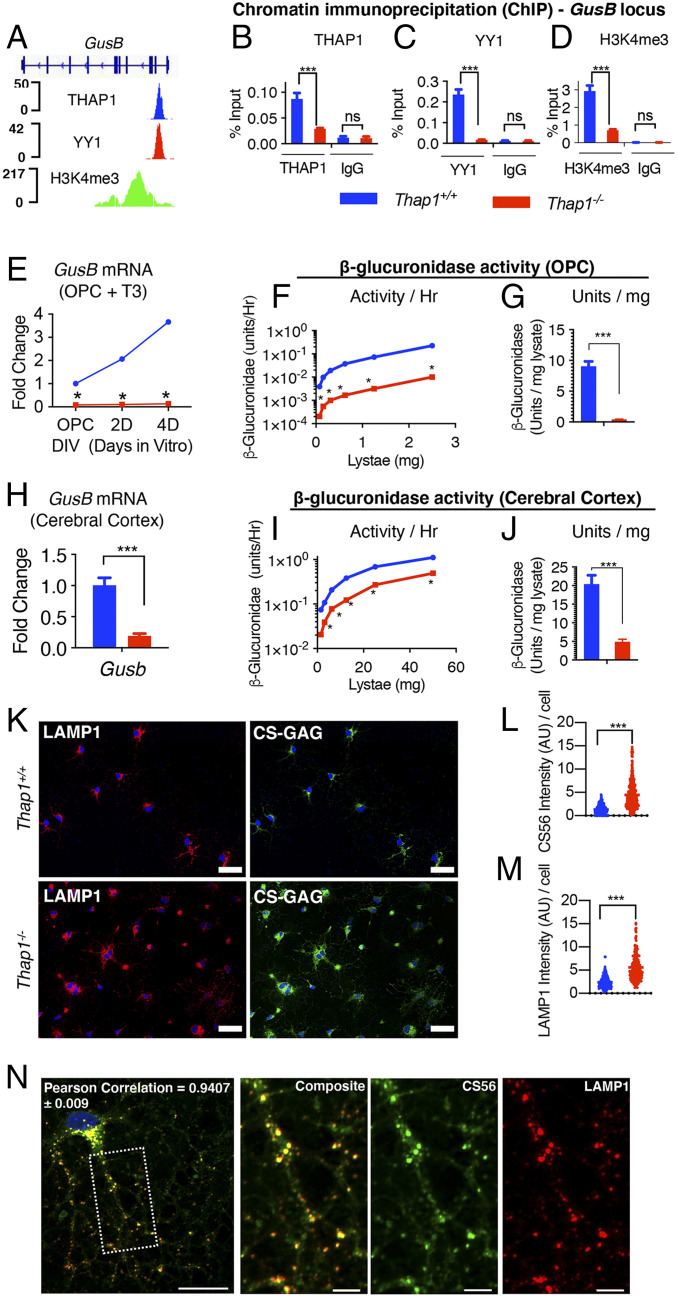
Fig. 5.
THAP1 directly binds to and regulates the GusB gene encoding the GAG-catabolizing lysosomal enzyme β-glucuronidase. (A) Genome browser track (using Integrative Genomics Viewer) showing ChIP sequencing signals for THAP1, YY1, and H34me3 at the GusB locus in K652 cells (Encyclopedia of DNA Elements dataset). (B–D) Quantitative ChIP demonstrating THAP1-dependent binding of YY1 and H3K4me3 methylation at the GusB promoter region in OL (+T3 − DIV4). Binding, represented as percentage input (y-axis), is demonstrated for THAP1 (B) (x-axis) (Thap1+/+ = 0.087% ± 0.008; Thap1-/- = 0.02% ± 0.001; t test: t(4) = 6.85; and P = 0.02); YY1 (C) (x-axis) (Thap1+/+ = 0.23% ± 0.017; Thap1-/- = 0.018% ± 0.0009; t test: t(2) = 12.85; and P = 0.006); and H3K4me3 (D) (x-axis) (Thap1+/+ = 2.93% ± 0.219; Thap1-/- = 0.707% ± 0.036; and t test: t(2) = 10.04; P = 0.0098) and their respective isotype control IgG (Goat IgG or Rabbit IgG; x-axis) at the GusB promoter region. The bar graph shows mean values ± SEM. Percentage input represents the final amount of immunoprecipitated chromatin/gene from corresponding Thap1+/+ and Thap1-/- OL cells (Materials and Methods); final values represent the average of three technical repeats from a single clonal population per genotype. (E–J) THAP1 loss significantly reduces GusB mRNA expression and β-glucuronidase enzyme activity in OLs and in CNS tissue. (E) GusB mRNA expression (qRT-PCR) from Thap1+/+- and Thap1-/--differentiating OL (OPC, DIV2, and DIV4). GusB expression was normalized to Rpl19 expression and is represented as fold change (y-axis), with respect to Thap1+/+. Line graphs show mean values ± SEM. Final values represent the three technical repeats from a single clonal population per genotype. (F and G) Deficient β-glucuronidase enzyme activity in Thap1-/- OPC. The line graph shows the mean value of β-glucuronidase activity (y-axis = units/hour) (F) for Thap1+/+ and Thap1-/- OPC lysate (0 to 3 μg; x-axis) derived from fluorometry assay. The bar graph shows mean ± SEM values of normalized β-glucuronidase activity units/lysate (milligram) (G) for OPC (Thap1+/+ = 9.05 U/mg ± 0.803; Thap1-/- = 0.396 U/mg ± 0.038; and t test: t(10) = 10.76; p < 0.0001); final values represent an average of three readings from a two clonal population per genotype. (H) GusB mRNA expression (qRT-PCR) from control (Thap1+/flx) and THAP1 N-CKO (Thap1flx/−;Nestin-Cre+) CNS (cerebral cortex, age P21). GusB expression was normalized to Rpl19 expression and is represented as fold change (y-axis) with respect to control. Line graphs show mean values ± SEM; n = 3. (I and J) Deficient β-glucuronidase enzyme activity in THAP1 N-CKO CNS. The line graph shows the mean value of β-glucuronidase activity (y-axis = units/hour) (I) for control (Thap1+/flx) and THAP1 N-CKO (Thap1flx/−;nestin-Cre+) cerebral cortex lysate (0 to 60 μg; x-axis) derived from fluorometry assay. (J) Bar graph shows mean ± SEM values of normalized β-glucuronidase activity units/lysate (milligram) (J) for CNS (control = 20.43 U/mg ± 2.35; N-CKO = 4.90 U/mg ± 0.68; and t test: t(10) = 6.34; p < 0.0001). Final values represent an average of three readings from a two clonal population per genotype. Two-way ANOVA demonstrates a main effect of genotype (P <0.01) for GusB mRNA (E and H) expression and β-glucuronidase activity (F and J) in OPC (E and F) or cerebral cortex (H and I). * represents time points in which significant differences exist using post hoc Sidak’s multiple comparison test. (K) Representative images (scale bar, 50 μm) derived from images obtained as a tiled scan and corresponding quantification (L and M) of Thap1+/+ and Thap1-/- OL cells (DIV4) immunostained under conditions of membrane permeabilization for CS-56 (CS-GAG; Thap1+/+ = 1.34 ± .072; Thap1-/- = 4.44 ± 0.16; t test: t(530) = 14.51; and P < 0.0001) or LAMP1 (Thap1+/+ = 2.36 arbitrary units [AU] ± 0.082; Thap1-/- = 5.57 AU ± 0.20; t test: t(412) = 15.27; and P < 0.0001). n = 2 clonal lines (100 cells per clone) per genotype. Each data point in the scatter plot represents CS-56 or LAMP1 staining intensity for individual cells. (N) Representative image (scale bar, 20 μm) of CS-GAG (CS-56) colocalization with lysosomes (LAMP1) in OL (DIV4). The region, the dashed box, is represented in a magnified view for individual channels (CS565 and LAMP1) in the inset (scale bar, 5 μm). Pearson’s coefficient value (0.94 ± 0.009) shows significant colocalization (R = 0.94 ± 0.009) of CS565 and LAMP1.

