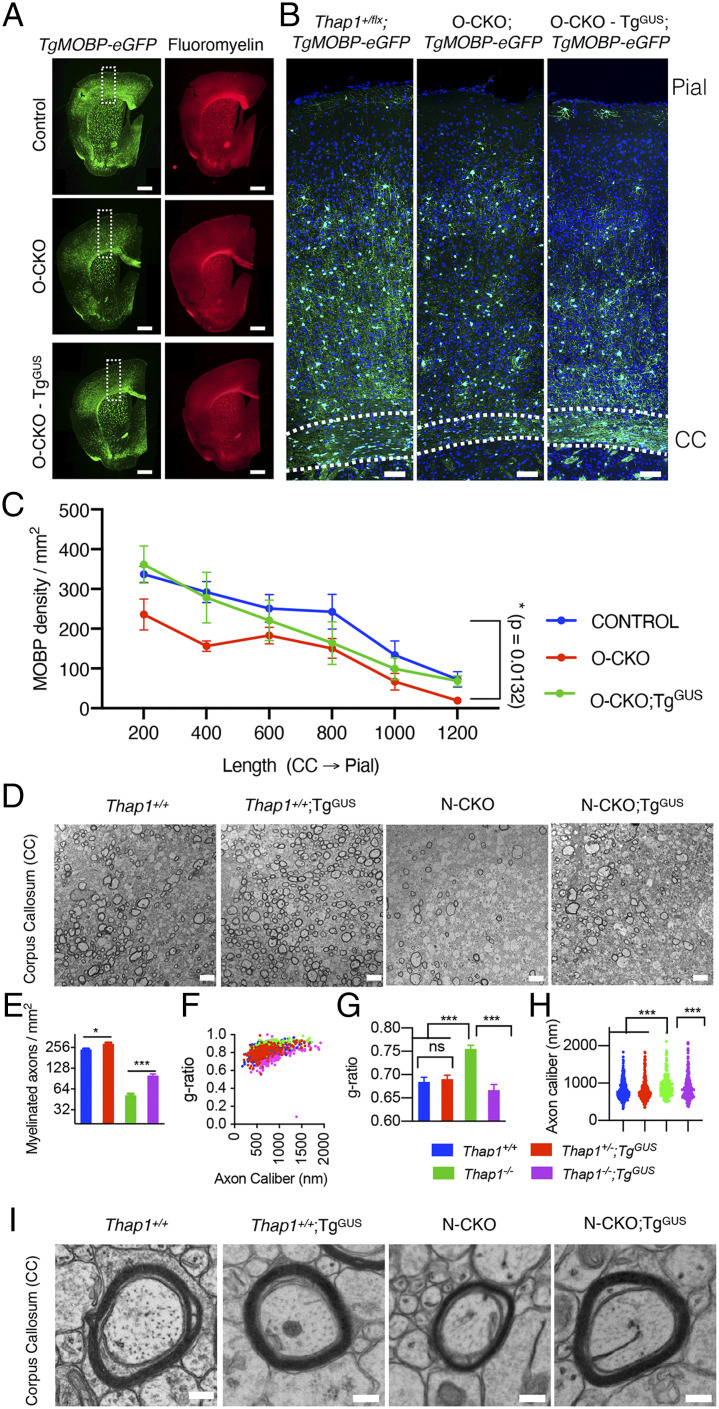
Fig. 7.
β-glucuronidase overexpression rescues the myelination defect in the THAP1 null CNS. (A) Representative images (scale bar, 500 μm) of a coronal hemisection derived from stitching multiple images (Image J) demonstrating MOBP-eGFP and fluoromyelin staining for P80 tissue derived from control (Thap1flx/+;TgMOBP-eGFP), O-CKO (Thap1flx/−;Olig2-Cre+;TgMOBP-eGFP), and O-CKO;TgGUS (Thap1flx/−;Olig2-Cre+;TgGUS;TgMOBP-eGFP). Dashed boxes indicate the corresponding cortical regions analyzed for MOBP-OL number. Representative images (B) (scale bar, 100 μm) and corresponding quantification (C) of MOBP-OL counts (MOBP-OL/square millimeters; measured through the thickness of the cortex from CC through the pial surface) from P80 control, O-CKO, and O-CKO-TgGUS. Two-way ANOVA post hoc analysis shows the main effect of genotype, control versus O-CKO P = 0.0132; control versus O-CKO;TgGUS, and P = 0.156; n = 3 for control, 4 for O-CKO, and 3 for O-CKO-TgGUS. (D) Representative transmission electron microscopy (EM) images (scale bar, 4 μm) of the genu of CC at P21 from control (Thap1+/+;Cre negative) or N-CKO (Thap1flx/−;Nestin-Cre+) with or without TgGUS. (E–H) Quantification of EM images (n = 3 per genotype) demonstrates that β-glucuronidase overexpression (N-CKO; TgGUS) significantly increases myelination in the THAP1 null CNS. (E) Density of myelinated axons (number of axons/square millimeters). Mean ± SEM; control = 238.09 ± 12.58, control;TgGUS = 289.85 ± 10.36; N-CKO = 51.74 ± 2.70; N-CKO;TgGUS 100.71 ± 4.790; and one-way ANOVA F(3,6) = 182.7, P < 0.0001, Dunnett’s multiple comparisons test: adjusted P value < 0.0001. (F and G) The g-ratio represented in relation to axon caliber (F) and by genotype (G, mean ± SEM; control = 0.684 ± 0.009, control;TgGUS = 0.690 ± 0.0087; N-CKO = 0.755 ± 0.0082; N-CKO;TgGUS = 0.666 ± 0.0119; and one-way ANOVA F(3,8) = 15.68, P = 0.001, Dunnett’s multiple comparisons test: adjusted P value < 0.004). (H) Axon caliber (each data point represents axon caliber [nanometer] of individual axons; control = 813.2 nm ± 14.76, control;TgGUS = 825.9 nm ± 19.54; N-CKO = 935.0 ± 21.42; N-CKO;TgGUS = 897.4 ± 21.08; and one-way ANOVA F(3,1047) = 8.613, P = 0.001, Dunnett’s multiple comparisons test: adjusted P value < 0.004). n = 3 per genotype. (I) Representative EM images (scale bar, 200 nm) demonstrating the rescue of myelin thickness (g-ratio) observed in N-CKO with β-glucuronidase overexpression (N-CKO; TgGUS).

