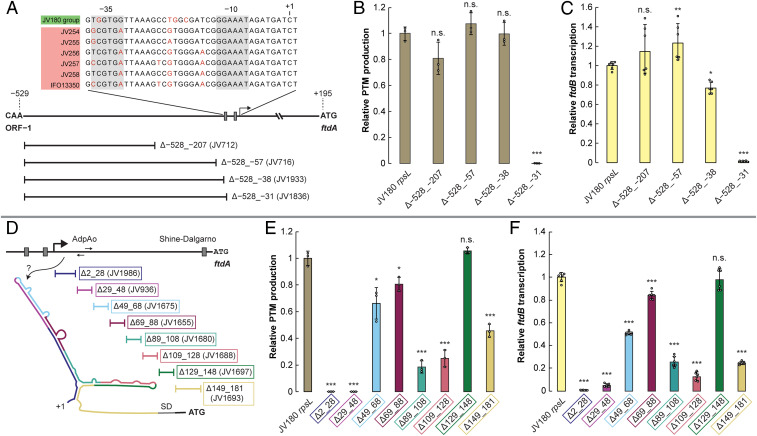
Fig. 2.
Mapping of PftdA and identification of cis-regulatory elements by deletion analysis. (A) Diagram of the JV180 PftdA region, with the zones deleted upstream of PftdA diagrammed below. (Inset) Alignment of the core promoter sequence (note: the sequences are identical in JV180-like PftdAs). (B) Relative PTM production from JV180 mutants, with deletions in the upstream region of PftdA (n = 3). (C) Relative ftdB transcript abundance from JV180 mutants, with deletions in the upstream region of PftdA (n = 6). (D) Diagram of the PftdA UTR downstream of the transcript start site. Regions deleted downstream of PftdA are diagrammed below. (Inset) Cartoonized representation of the JV180 PftdA UTR secondary structure predicted by mFold. (E) Relative PTM production from PftdA UTR truncation mutants (n = 3). (F) Relative ftdB transcript abundance from PftdA UTR truncation mutants (n = 6). The statistical significance in the differences in PTM production or transcription were calculated by two-tailed Student’s t test, relative to the JV180 rpsL mutant, JV307. *P < 0.05, **P < 0.01, ***P < 0.001, and n.s. = not significant. Error bars represent SD.

