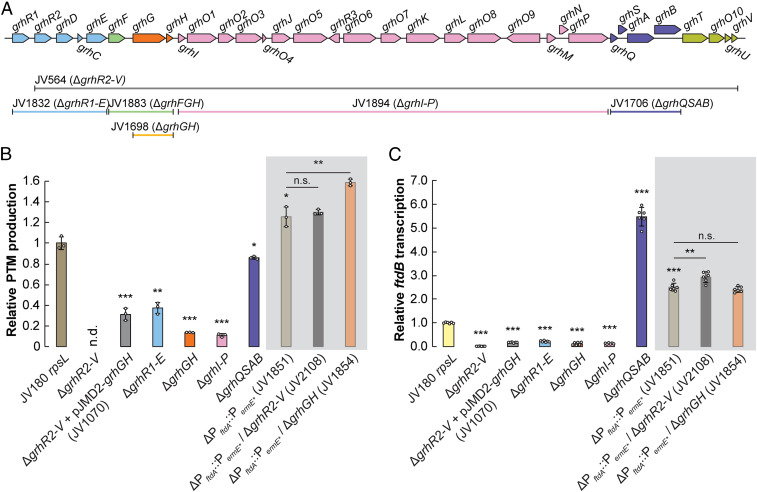
Fig. 5.
Deletions in the JV180 griseorhodin (grh) BGC often negatively impact PTM production and transcription by PftdA. (A) Diagram of the JV180 grh BGC, with gene ranges deleted in various mutants mapped below as corresponding, colored bars. (B) Relative PTM production from various grh mutants in JV180 rpsL (white background) and JV180 ΔPftdA::PermE* background strains (gray background, n = 3). n.d. = not detected. (C) Relative ftdB transcript abundance from various grh mutants in JV180 rpsL and JV180 ΔPftdA::PermE* background strains, as noted in B (n = 6). The statistical significance in the differences in PTM production or transcription were calculated by two-tailed Student’s t test, relative to the JV180 rpsL mutant, JV307, or otherwise indicated. *P < 0.05, **P < 0.01, ***P < 0.001, and n.s. = not significant. Error bars represent SD.

