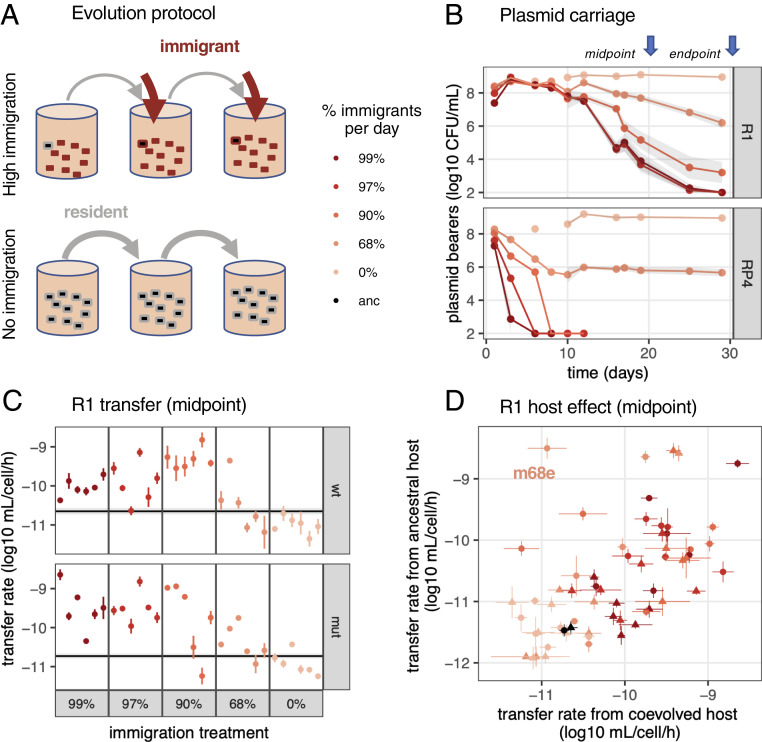
Fig. 1.
Evolution of plasmid transfer rate with varying host availability. (A) Experimental evolution regime. Plasmid-bearing cells (black) were first mixed with plasmid-free cells, then evolving populations were diluted every day to fresh medium (gray arrows) mixed in varying frequencies to plasmid-free cells (red arrows). Each treatment was performed in six replicates with either WT or mut E. coli hosts. (B) Plasmid population dynamics. Initially one of six replicates was measured until day 12; the treatment average is shown ± SEM (shaded area). (C) Midpoint R1 conjugation rates. The black line and shaded area are the geometric mean and SE, respectively, of ancestral plasmid transfer rate; each colored dot and line indicates, respectively, the geometric mean and SE of evolved clones (n = 3). WT clones are shown on the Top, and mut clones on the Bottom. (D) Effect of host evolution on R1 conjugation. The x axis shows transfer rates measured from plasmid-bearing coevolved hosts (same as in C); the y axis shows rates from ancestral hosts carrying evolved plasmids. Dots and lines indicate, respectively, the geometric mean and SE (n = 3). Circles show the WT background and triangles, the mut background.

