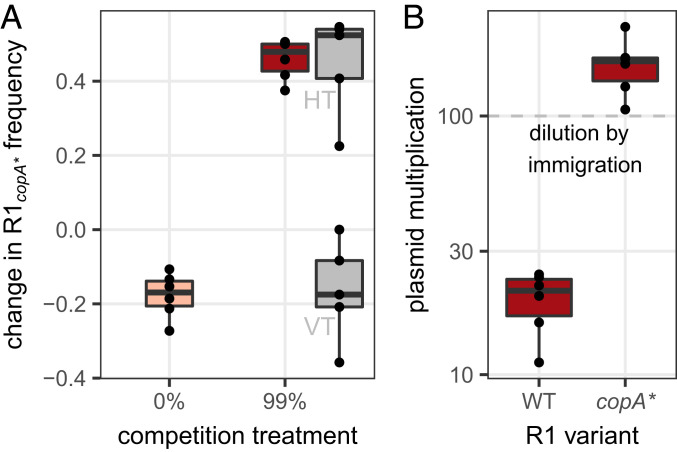
Fig. 5.
copA* variants trade-off vertical against horizontal transmission. (A) Change in frequency of R1copA* in competition with R1WT, in the absence or presence of immigration. In the presence of immigration (99% treatment), the change in frequency within initial donors (VT) and in transconjugants (HT) is shown in gray. The center value of the boxplots shows the median, boxes show the first and third quartile, and whiskers represent 1.5 times the interquartile range; individual data points are shown as dots (n = 6). (B) Detail of the change in plasmid-carrying cell density for each variant in the presence of immigration. The center value of the boxplots shows the median, boxes show the first and third quartile, and whiskers represent 1.5 times the interquartile range; individual data points are shown as dots.

