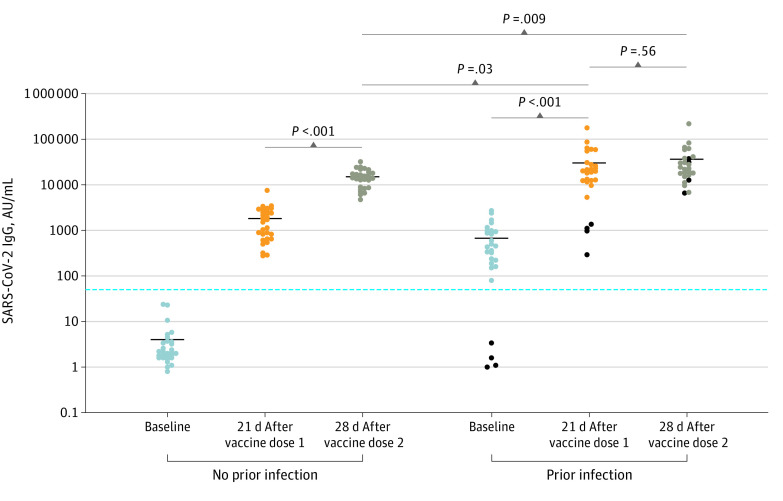
Figure. SARS-CoV-2 Immunoglobin (Ig) G Serological Response in Infection-Naive and Previously Infected Individuals After 1 or 2 Doses of BNT162b2.
Quantitative SARS-CoV-2 IgG levels at baseline (blue dots), 21 days after vaccine dose 1 (orange dots), and 28 days after vaccine dose 2 (brown dots) in infection-naive or previously infected individuals. Horizontal black bars represent mean quantitative IgG levels (AU/mL) within the indicated groups. Black dots represent 4 individuals with a previous positive SARS-CoV-2 polymerase chain reaction but did not have detectable SARS-CoV-2 IgG at baseline. Horizontal blue line denotes the assay limit of detection cutoff. Statistical analysis was performed using unpaired 2-tailed t test. AU indicates arbitrary unit.

