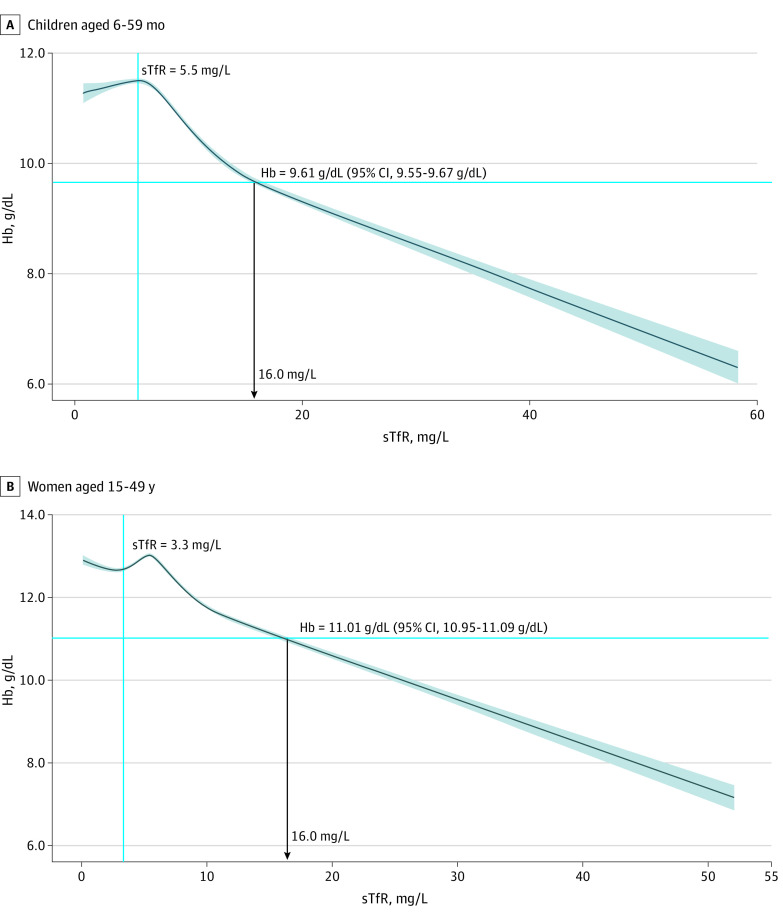
Figure 2. Restricted Cubic Spline Curve Analyses for the Association Between Hemoglobin (Hb) and Soluble Transferrin Receptor (sTfR) Concentrations Among 14 854 Preschool Children Aged 6 to 59 Months and 24 198 Nonpregnant Women Aged 15 to 49 Years.
Hb values were adjusted for altitude, when available (Afghanistan, Azerbaijan, Colombia, Ecuador, Great Britain, Laos, Malawi, Mexico 2006 and 2012, and Rwanda); otherwise, no adjustment was applied, or the altitude was less than 1000 m, so no adjustment was needed. Hb values were further adjusted for smoking among women (Colombia, Ecuador, Mexico 2006 and 2012, Great Britain, and US). The 95% CIs around Hb inflection points were obtained from 5000 bootstrap resampling and were bias corrected using bias-corrected acceleration. The shaded region around the curve indicates the 95% confidence bands. Analyses were based on all participants with nonmissing sTfR concentrations and Hb. To convert Hb to grams per liter, multiply by 10.

