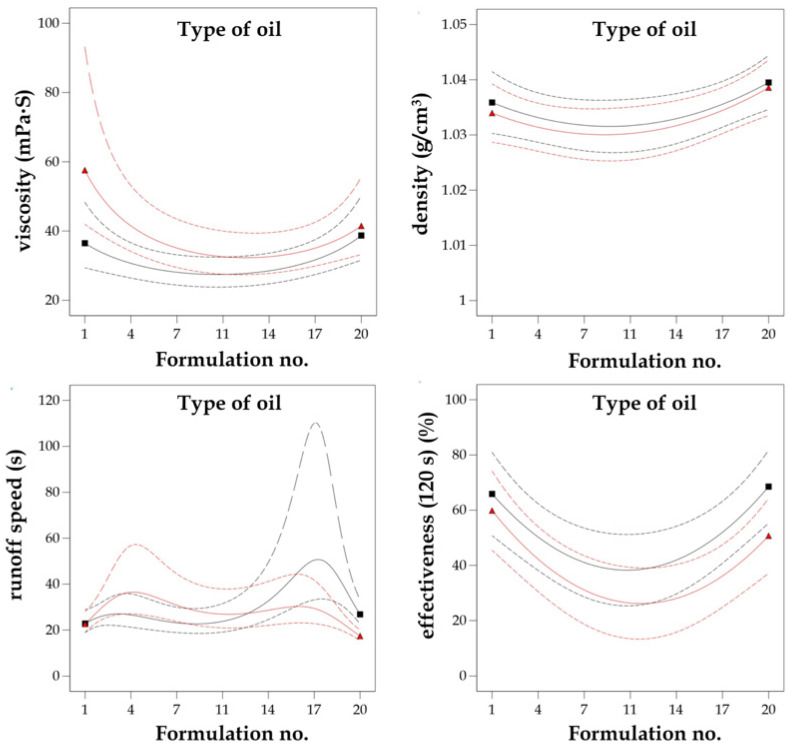
Figure 6.
Interaction plots between independent variables the dependent variables (A = no. of formulation, B = type of oil) affecting the behavior of response variables (Y1 = viscosity, Y2 = density, Y3 = runoff speed, and Y4 = effectiveness (120 s)). The red line indicates sunflower oil, while black line corresponds to rapeseed oil.

