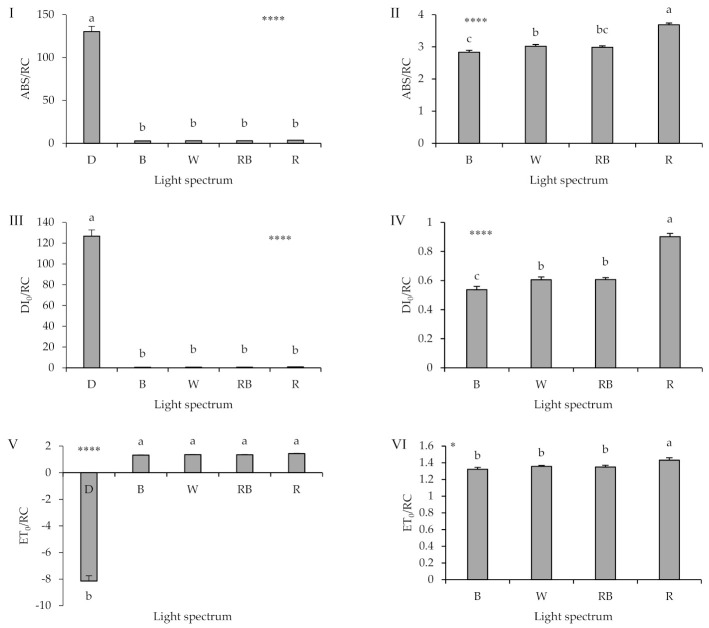
Figure 6.
Specific energy fluxes per reaction center (RC) for energy absorption (ABS/RC; I, II), dissipated energy flux (DI0/RC; III, IV), electron transport flux (ET0/RC; V, VI); equations and explanations in Table 2) from the fluorescence transient exhibited by leaves sampled from grafted watermelon seedlings exposed for 12 days to either darkness (D) or different light quality regimes [blue (B), white (W), red and blue (RB), as well as red (R); see spectrum in Supplementary Figure S3]. Photosynthetic photon flux density was 20 ± 1 µmol m−2 s−1 during the first 2 days, and 50 ± 1 µmol m−2 s−1 during the following days. The Panels II, IV, and VI (on the right) represent the same data as the Panels I, III, and V (on the left), besides the darkness treatment which was excluded. Nine plants per treatment were assessed. Different letters indicate that values are significantly different at p < 0.01 according to Duncan’s multiple range tests. Bars represent SEM. Significance at the 0.05, and 0.0001 probability levels is indicated by * and ****, respectively.

