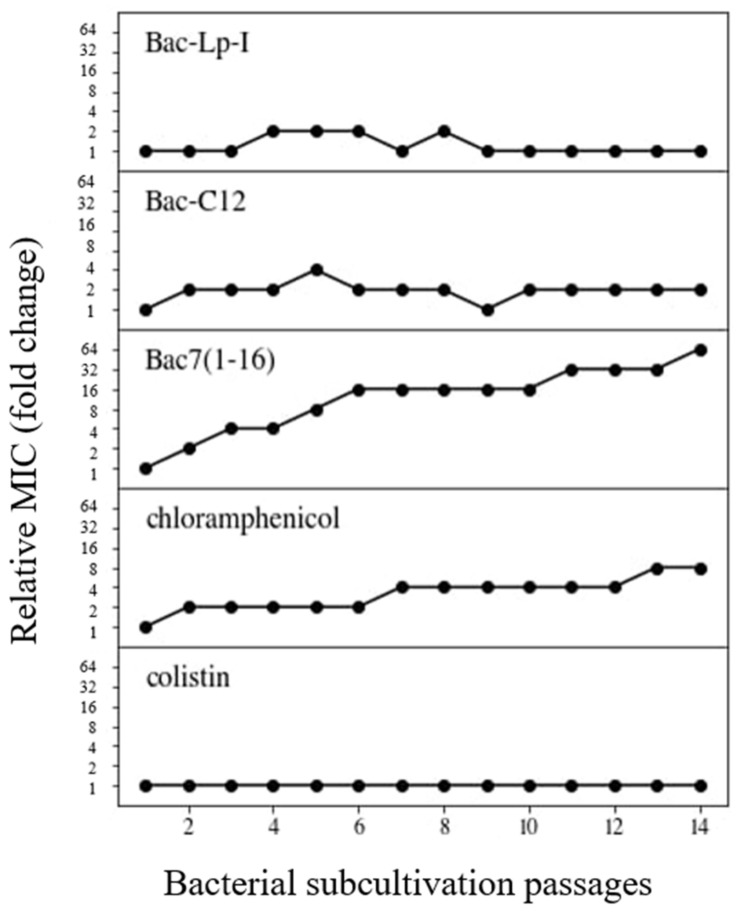
Figure 4.
Susceptibility variation of E. coli ATCC 25922 to different lipopeptides and antibiotics. Relative MIC values represent the MIC fold-change observed during 14 passages of bacterial subcultures compared to the original MIC value against the wild-type. Bacterial cells grown at the highest concentration of the antimicrobial (1/2MIC) were subcultured and used for the next MIC assay. The procedure was repeated for 14 passages. Chloramphenicol and colistin were used as reference antibiotics for non-lytic and lytic mode of action, respectively. Each plot represents a representative result of assays repeated at least two times. Whole data are reported in Table S1, Supplementary Materials.

