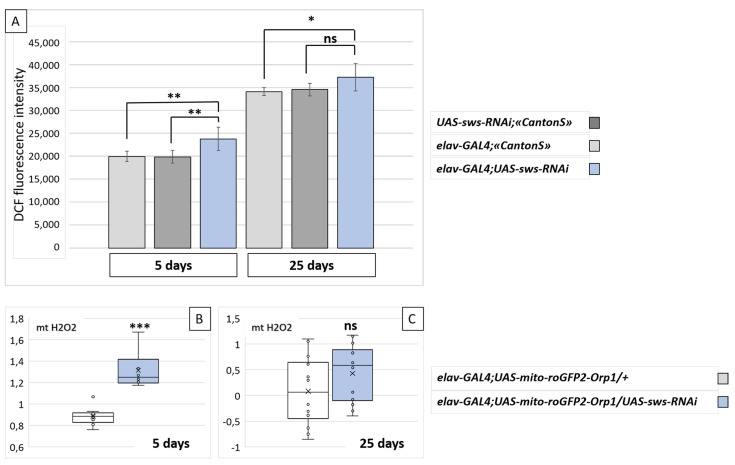
Figure 4.
Oxidant levels in the brains of flies with the neuronal sws knockdown. (A) Fluorescent signal levels corresponding to the total reactive oxygen species concentration in the brain samples of flies with the neuronal sws knockdown (elav-GAL4; UAS-sws-RNAi, blue boxes) and of corresponding controls (light grey boxes—F1 males obtained from crossing an elav-GAL4 female and CantonS male; dark grey boxes—F1 males obtained from crossing a CantonS female and UAS-sws-RNAi male) at different ages. Mean ± 95% CI, Dunnett’s test, ** p < 0.01; * p < 0.05, ns—no significant difference (p > 0.05), N = 7. (B,C) Relative level of hydrogen peroxide in neuron mitochondria of the brain in sws knockdowns (elav-GAL4;UAS-mito-roGFP2-Orp1/UAS-sws-RNAi, blue boxes) and in controls (elav-GAL4;UAS-mito-roGFP2-Orp1/+, white boxes) at the 5th (B) and the 25th (C) day. OY axis—relative ratio of the sensor fluorescence (see Section 4). Mann–Whitney test, *** p < 0.001, ns—no significant difference (p > 0.05), N = 12.

