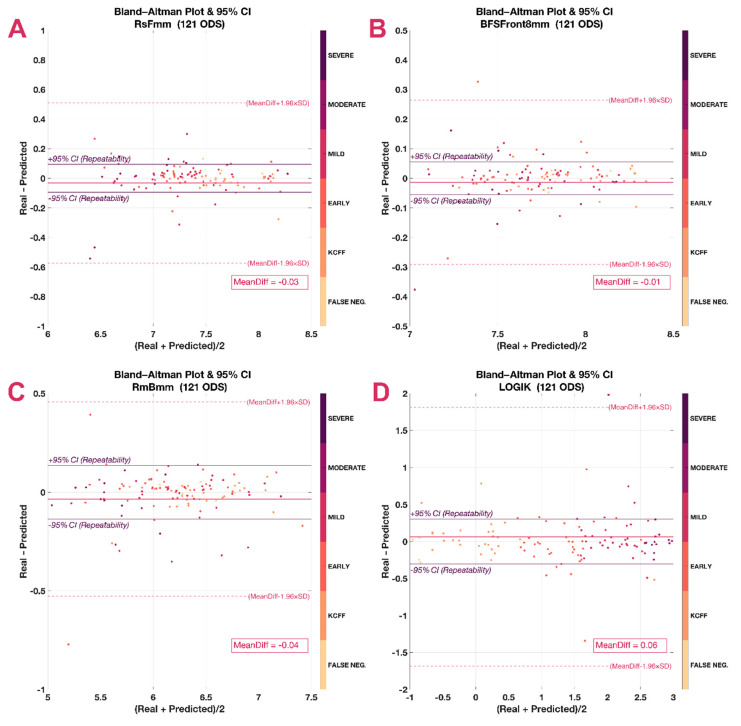
Figure 4.
Bland–Altman plots. Besides the mean difference (MeanDiff) and its confidence intervals (dashed line), they include the repeatability (continuous line and italics). (A) Steepest radius of the front surface in mm (RsF), (B) average radius of the back surface in mm (RmB), (C) best fit sphere of the front surface considering an 8 mm area (BFSF), (D) logistic index for keratoconus, LOGIK.

