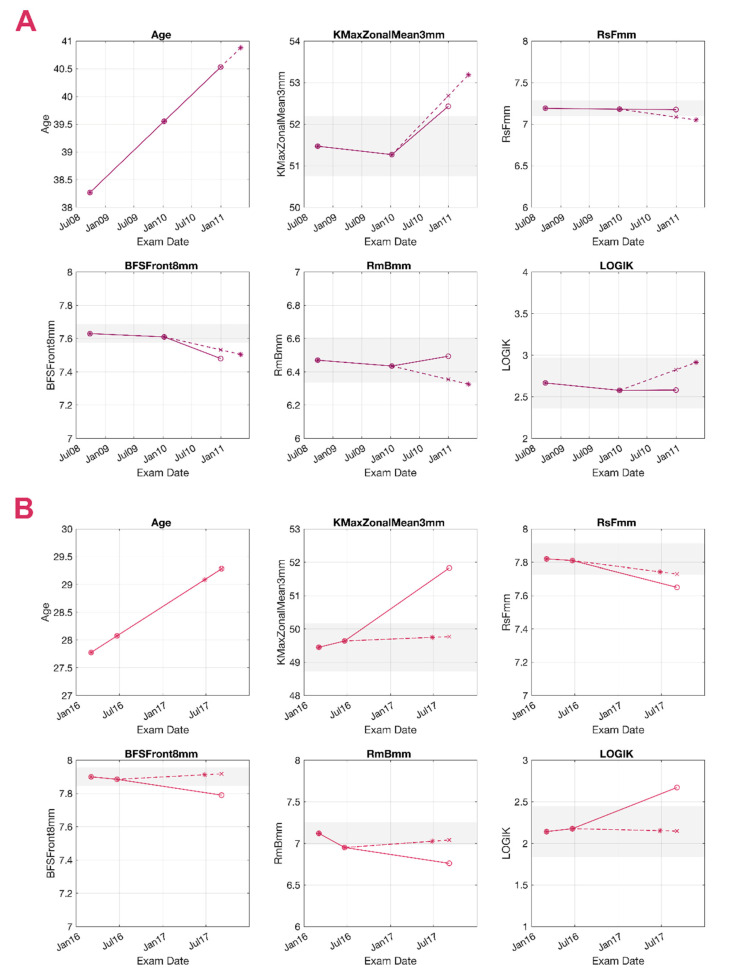
Figure 5.
Prediction of a true-positive (TP) and a false-negative (FN) case. Grey areas represent the 95% confidence interval (95 CI) around the baseline value. Circles (o) represent the measured values in 3 consecutive examinations, and the asterisk (∗) represents the output of the system. The cross (×) is calculated by linear interpolation and aligned to the 2nd follow-up date. Continuous lines represent the measured trend, and the dashed lines represent the predicted trend. Measurements within the 95 CI are presented with the noise reduction applied. (A) TP, 38 years old. Significant change was found in the average keratometry in a 3 mm area around the maximum curvature point (KmaxZonalMean3mm) and the best fit sphere (BFS) in both the prediction and the real values. (B) FN, 27 years old. Although all 5 variables presented significant change, the system classified the eye as stable (none of the predicted variables reached the 95 CI). BFSF: best fit sphere of the front surface considering an 8 mm area, RmB: average radius of the back surface in mm, RsF: steepest radius of the front surface in mm.

