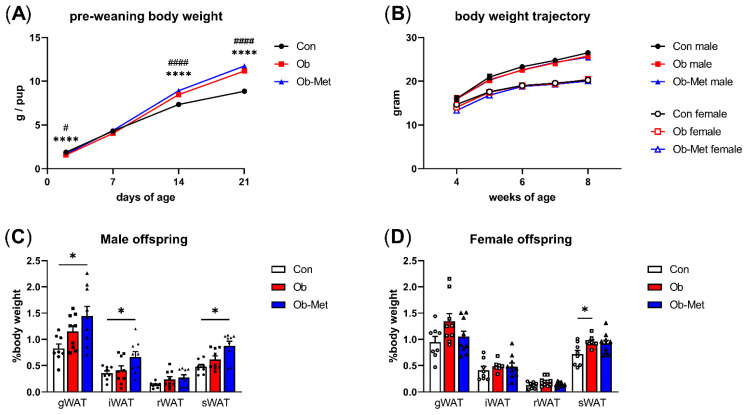
Figure 1.
Offspring growth and adiposity in 8-week-old offspring. (A) Growth trajectory of neonatal offspring (n = 26–33 independent litters per group, sexes combined). **** p < 0.0001 vs. Con vs. Ob, # p < 0.05, #### p < 0.001 Con vs. Ob-Met using two-way ANOVA with Tukey’s multiple comparison test. (B) Post-weaning body weight trajectory in male and female offspring until 8 weeks of age (n = 10–14 independent litters per group). (C,D) Weight of white adipose tissue (WAT) depots collected at 8 weeks of age relative to offspring body weight (n = 8–10 independent litters per group). Outliers were excluded from (C) iWAT and sWAT; female Ob (Grubb’s method, outlier excluded values 1.03% and 1.45%, respectively). * p < 0.05 using one-way ANOVA with Tukey’s multiple comparison test. gWAT = gonadal depot, iWAT = intraperitoneal depot, rWAT = retroperitoneal depot, sWAT = subcutaneous depot. Con (circles, solid line) = offspring of control-fed dams, Ob (squares, dashed line) = offspring of obese dams, Ob-Met (triangles, dotted and dashed line) = offspring of obese metformin-treated dams. Panels (B–D): closed symbols denote male offspring; open symbols denote female offspring.

