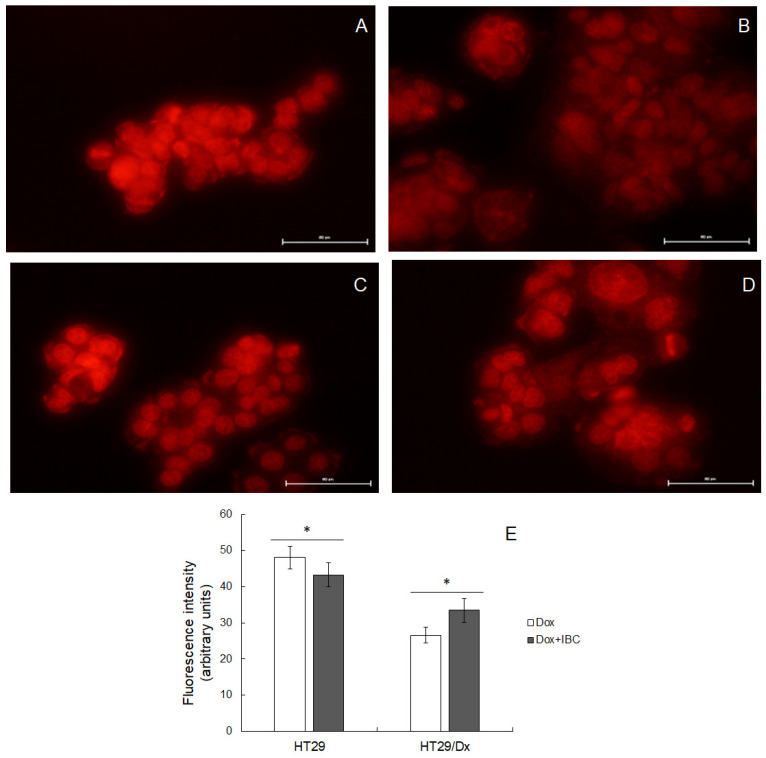
Figure 2.
Microscopic images of Dox fluorescence observed in HT29 (A) and HT29/Dx cells (B) in the presence of IBC (at 15 μM) (C,D) for HT29 and HT29/Dx cells, respectively). Scale bar is 50 μm. Illumination conditions were the same for all images. Intensity of intracellular fluorescence as measured by ImageJ software (E) is presented as the mean fluorescence values ± SD measured in 20 representative cells. The statistically significant differences between IBC-treated and untreated cells were determined using Student’s t-test (* p < 0.05).

