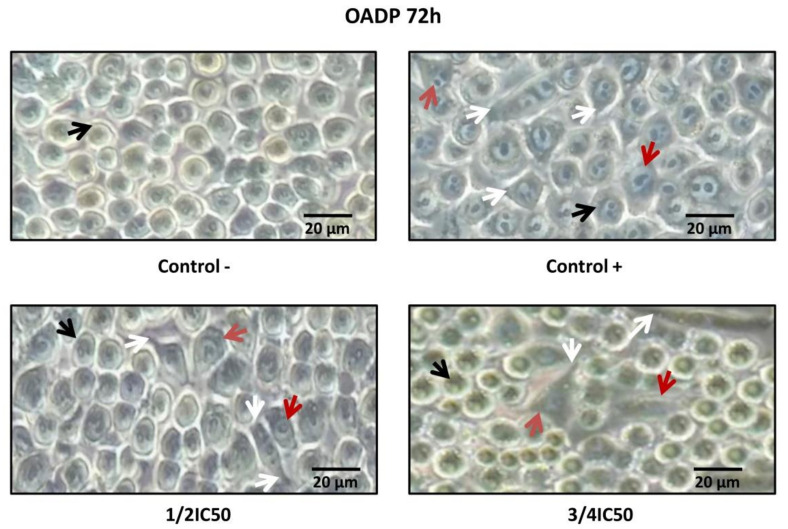
Figure 5.
Morphological transformation in RAW 264.7 cells stimulated with LPS and OADP treatment for 72 h at the ½ IC50 and ¾ IC50 concentrations. The black arrows indicate Raw 264.7 cells in monocyte state. The red arrows indicate Raw 264.7 cells in macrophage state. The white arrows indicate cytoplasmic projections.

