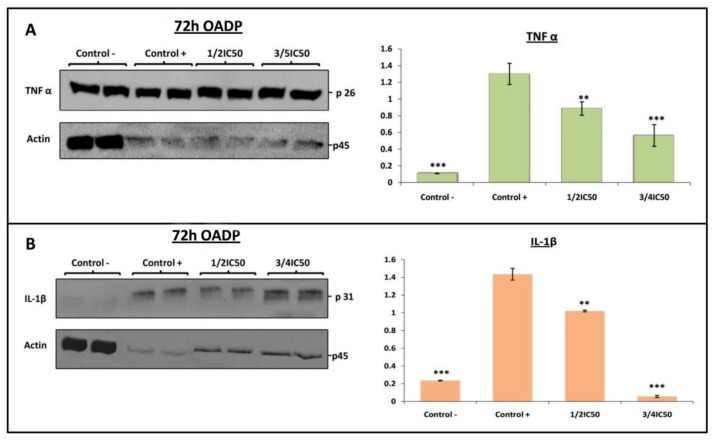
Figure 6.
Western blot of the levels of TNF-α (A) (p26) and IL-1β (B) (p31) proteins on LPS-stimulated Raw 264.7 cells, after treatment with OADP for 72h at the ½ IC50 and ¾ IC50 concentrations. Protein expression levels are expressed as arbitrary intensity units for each band compared to arbitrary intensity units for actin (p45). Variations in the relative percentages of TNF-α and IL-1β expression for each concentration are also shown. The values represent means ± S.D. of at least two separate experiments. Key: (**) p < 0.01 and (***) p < 0.001, with respect to LPS-treated control cells (positive control).

