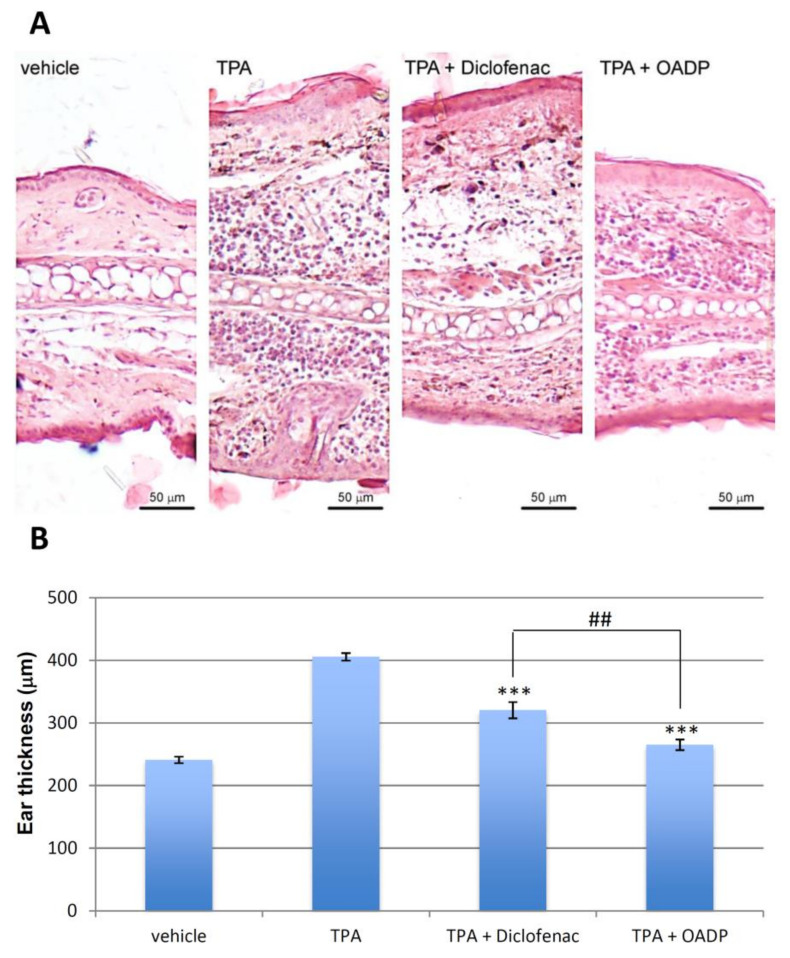
Figure 9.
Representative photomicrographs. (A) The images show a cross section of the ears treated with vehicle (acetone), TPA alone, TPA + Diclofenac, TPA + OADP, at a 125x magnification. Scale bars = 50 µm. (B) The graph represents the mean thickness of the ear of each treatment, expressed as mean ± S.E.M. (***) p < 0.001 compared to TPA treated ears. (##) p < 0.01 compared to the ears treated with TPA + Diclofenac.

