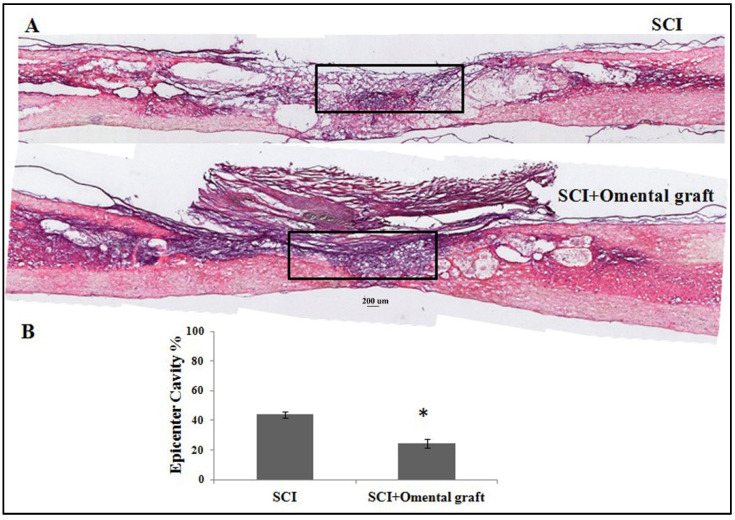
Figure 3.
Hematoxylin and eosin (H&E) staining of injured thoracic spinal cords. (A) Representative images of longitudinal spinal cord sections in contusive SCI rats with saline or omentum graft at 6 weeks post-injury. (B) Quantification of cavities in the injured epicenter (calculated from a rectangle area of 1500 × 300 dpi in the injured cords (shown in A)) of contusive SCI rats with saline or omentum graft. All pixels within the rectangles were analyzed with Image J software. Data are expressed as mean value ± SEM. The cavity in contusive SCI rats with omentum graft was significantly smaller (* p < 0.05).

