
Figure 8.
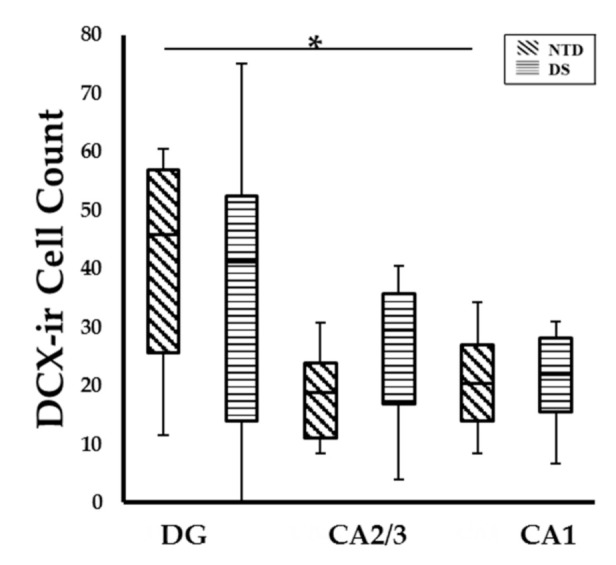
Box-plot showing no significant difference in DCX cell count between groups, however significantly higher numbers of DCX-ir cells were observed in the DG compared to CA1 subfield (p = 0.031) in NTD. * p < 0.05.
Official websites use .gov
A
.gov website belongs to an official
government organization in the United States.
Secure .gov websites use HTTPS
A lock (
) or https:// means you've safely
connected to the .gov website. Share sensitive
information only on official, secure websites.
Box-plot showing no significant difference in DCX cell count between groups, however significantly higher numbers of DCX-ir cells were observed in the DG compared to CA1 subfield (p = 0.031) in NTD. * p < 0.05.