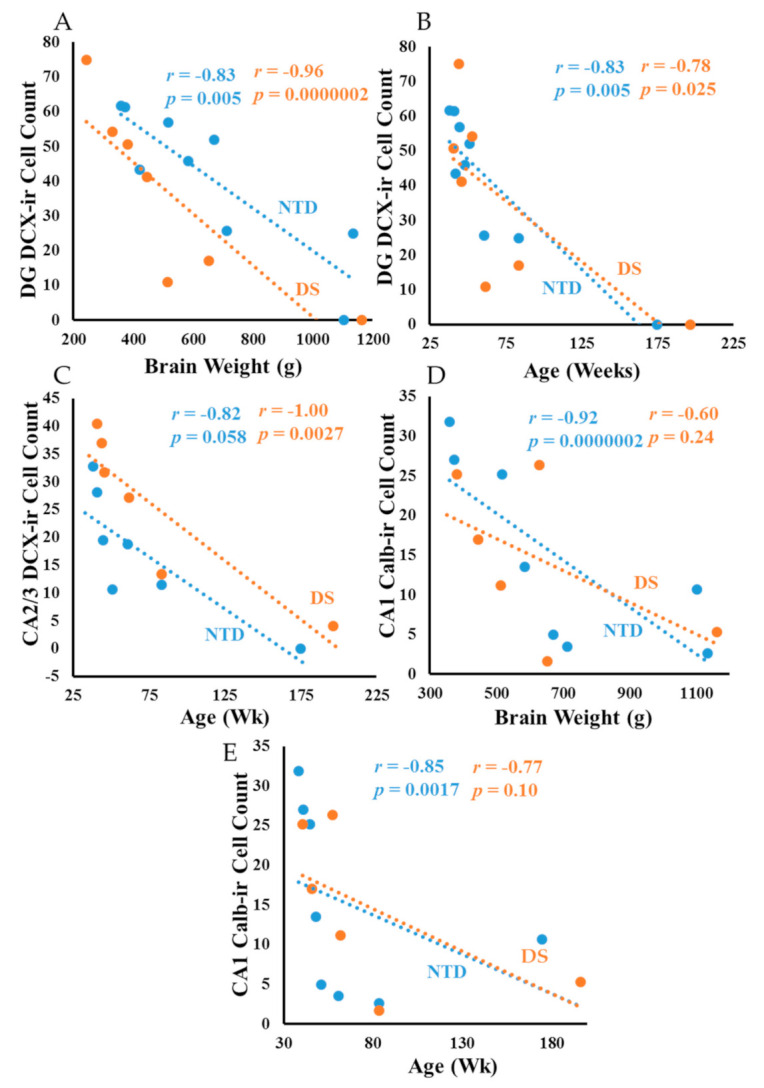
Figure 12.

Linear regression analysis showing a strong negative correlation between DG DCX-ir cell counts and brain weight in DS (A); Spearman rank, r = −0.96 p = 0.0000002), but weaker in NTD (A); Spearman rank, r = −0.83 p = 0.005). DG DCX-ir cell counts correlated negatively with age in NTD (B); Spearman rank, r = −0.83 p = 0.005) and DS (B); Spearman rank, r = −0.78 p = 0.025). DS CA2/3 DCX cell counts correlated negatively with age (C); Spearman rank, r = −1.00 p = 0.0027), but not in NTD. By contrast, CA1 Calb-ir cell counts showed a negative correlation with brain weight (D); Spearman rank, r = −0.92 p = 0.0000002) and age (E); Spearman rank, r = −0.85 p = 0.0017) in NTD.
