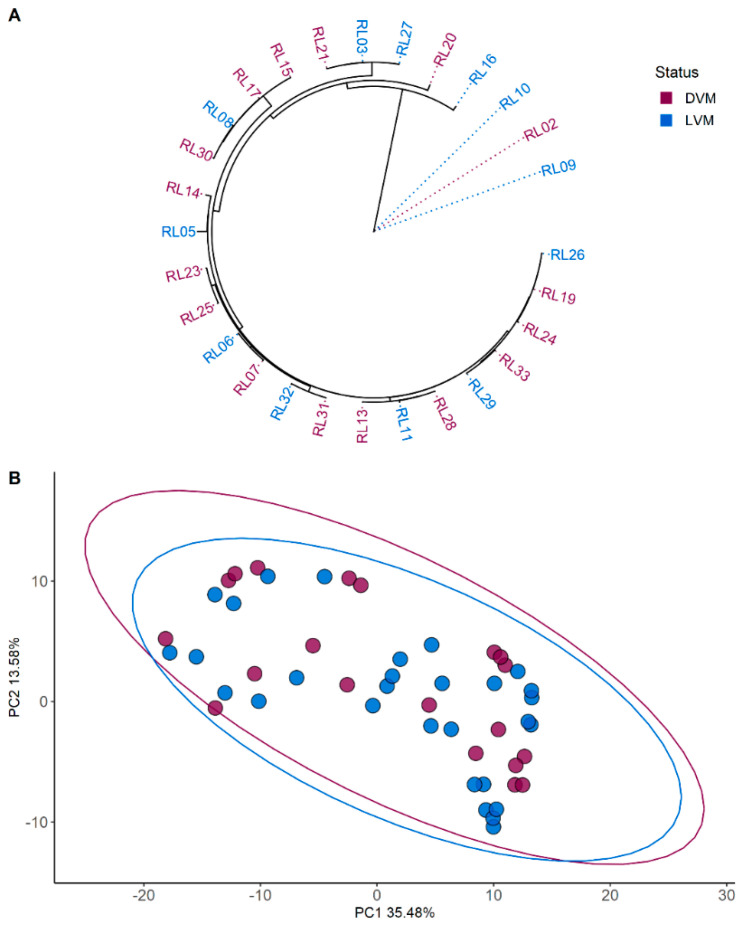
Figure 1.
Phylogenetic and metabolomic clustering analyses. (A) Core gene phylogenetic tree based on 28 strain sequences. (B) Untargeted metabolomics based on 18 strains. Ellipses represent the 95% confidence intervals. Colour coding represents grouping. Burgundy represents strains isolated from dysbiotic vaginal microbiota (DVM) and blue represents strains isolated from Lactobacillus dominated vaginal microbiota (LVM).

