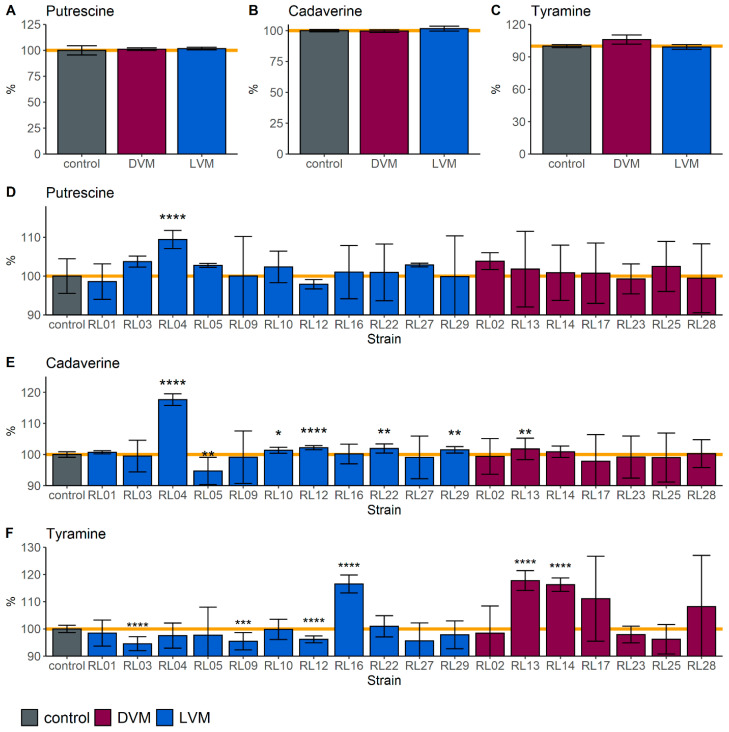
Figure 2.
Production and degradation of biogenic amines. Semi-quantitative metabolomics analysis of the differences in putrescine (A,D), cadaverine (B,E), and tyramine (C,F), between the control (VDMP media only) and spent media by microbiota status (A–C) and by strain (D–F). Burgundy represents strains isolated from dysbiotic vaginal microbiota (DVM) and blue represents strains isolated from Lactobacillus dominated vaginal microbiota (LVM). Data are represented as the means of 3 independent experiments (* p < 0.05, ** p < 0.01, *** p < 0.001, **** p < 0.0001).

