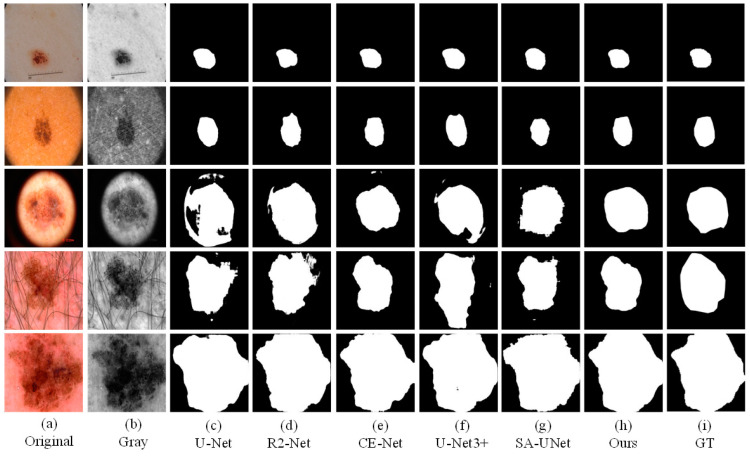
Figure 8.
The visual segmentation comparison chart of each comparison network on ISIC2018. (a,b) represents original and gray-scale images of input, (i) represents GT maps. (c–g) represent the segmentation results of comparison networks, respectively. (h) represents the segmentation result of our proposed method, from which it can be seen that the segmentation result of our proposed method is the closest to the GT maps.

