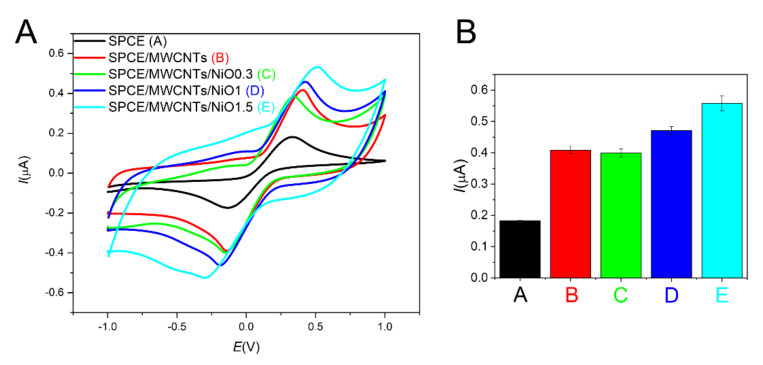
Figure 6.
Cyclic voltammograms for different modifications of the screen-printed electrode (A) (SPCE—black curve A, SPCE/MWCNT—red curve B, SPCE/MWCNT/NiO0.3—green curve C, SPCE/MWCNT/NiO1—blue curve D, SPCE/MWCNT/NiO1.5—turquoise curve E) in 5 mM K3[Fe(CN)6]. Comparison of the current response for the particular electrode modifications (B).

