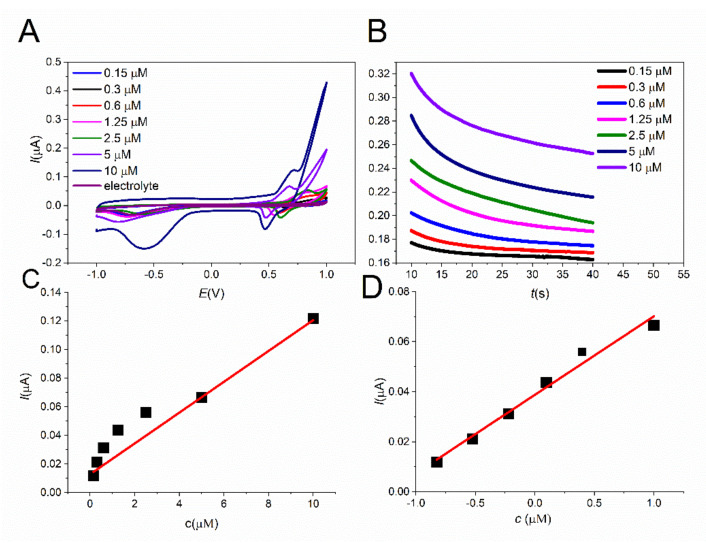
Figure 10.
Cyclic voltammograms of different insulin concentrations on SPCE/MWCNT/NiO1.5 (A) at a scan rate of 50 mVs−1.The dependence of peak current on the insulin concentration, as fitted by a linear function (C). I-t responses of SPCE/MWCNT/NiO1.5 to different insulin concentrations for 30 s after applying a potential of 0.7 V (B). The dependence of the current response on the insulin concentration, as fitted by a linear function (D).

