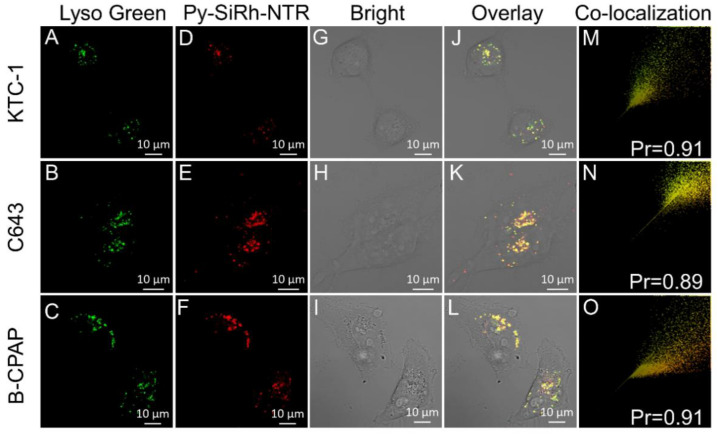
Figure 6.
Co-localization of Py-SiRh-NTR and LysoTracker green in KTC-1, C643 and B-CPAP cells. The cells were incubated with Py-SiRh-NTR (2 μM), and treated with LysoTracker green (200 nM). (A–C) The fluorescence from the LysoTracker green; (D–F) The fluorescence from the Py-SiRh-NTR; (G–I) Brightfield images of cells. (J–L) Merged image of images LysoTracker green and Py-SiRh-NTR. (M–O) Intensity correlation plot between Py-SiRh-NTR and LysoTracker green.

