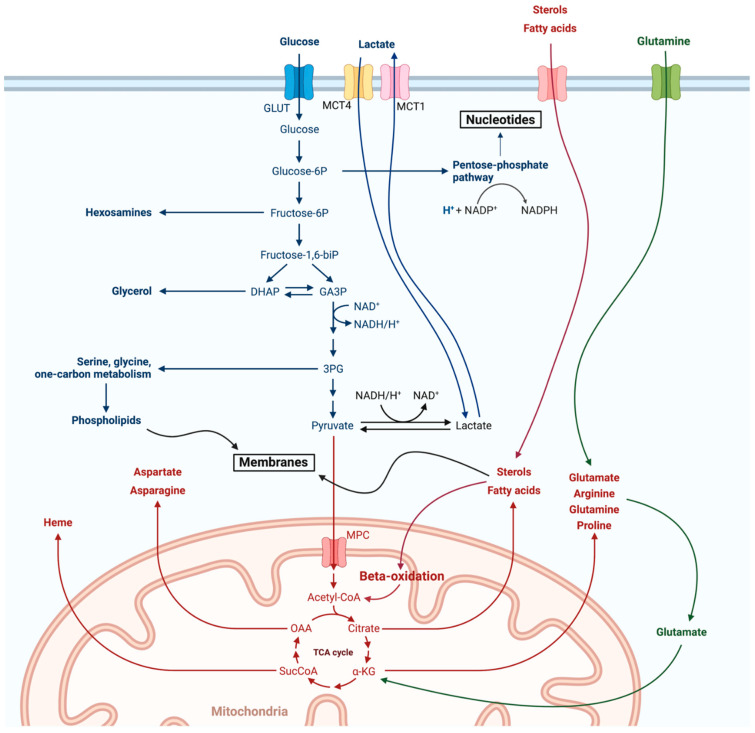
Figure 2.
Overview of cellular metabolism. Both the Warburg glycolysis (blue) as well as mitochondrial OxPhos (red) are shown here along with their major branching and/or feeding pathways. Anaplerosis of the TCA through glutaminolysis is of special interest as it will be discussed further in the article and is depicted in green. Adapted from “Warburg Effect”, by BioRender.com (2020). Retrieved from https://app.biorender.com/biorender-templates (accessed on 6 July 2021).

