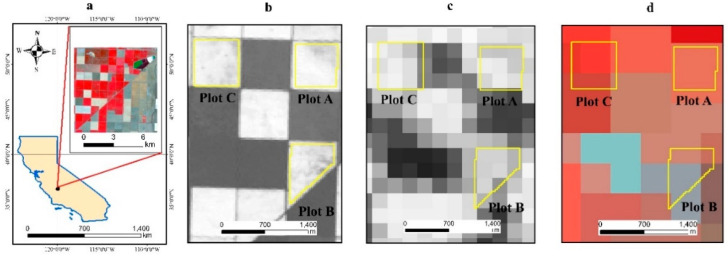
Figure 1.
Map of the study area; (a) California map and Landsat 30 m image of the study area on DOY 206; (b) study plots overlain on Landsat NDVI on DOY 206; (c) study plots overlain on MOD13Q1 250 m (MODIS NDVI) image on DOY 193; (d) study plots overlain on MOD09GA 500 m image (Band 2, band 1, band 4) on DOY 206.

