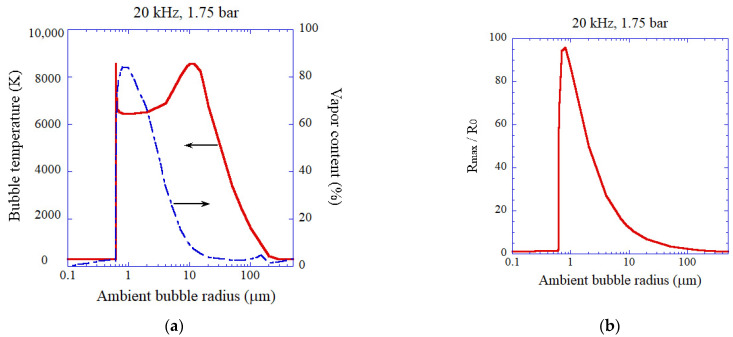
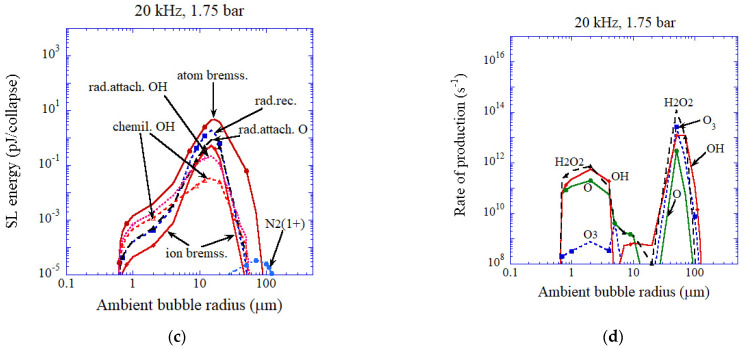
Figure 16.
The calculated results for an air bubble as a function of ambient bubble radius at 20 kHz and 1.75 bar in ultrasonic frequency and acoustic amplitude, respectively [43]. The horizontal axis is in logarithmic scale. (a) The peak temperature (solid) and the molar fraction of water vapor (dash dotted) inside a bubble at the end of the bubble collapse. (b) The expansion ratio (Rmax/R0). (c) The intensity of each emission process in SL. The vertical axis is in logarithmic scale. (d) The rate of production of each oxidant with the logarithmic vertical axis. Copyright 2008, with the permission of AIP Publishing.


