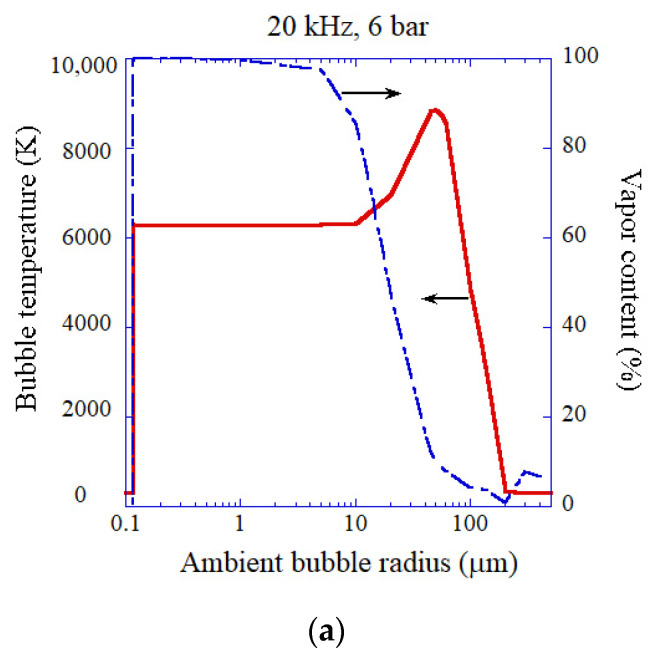
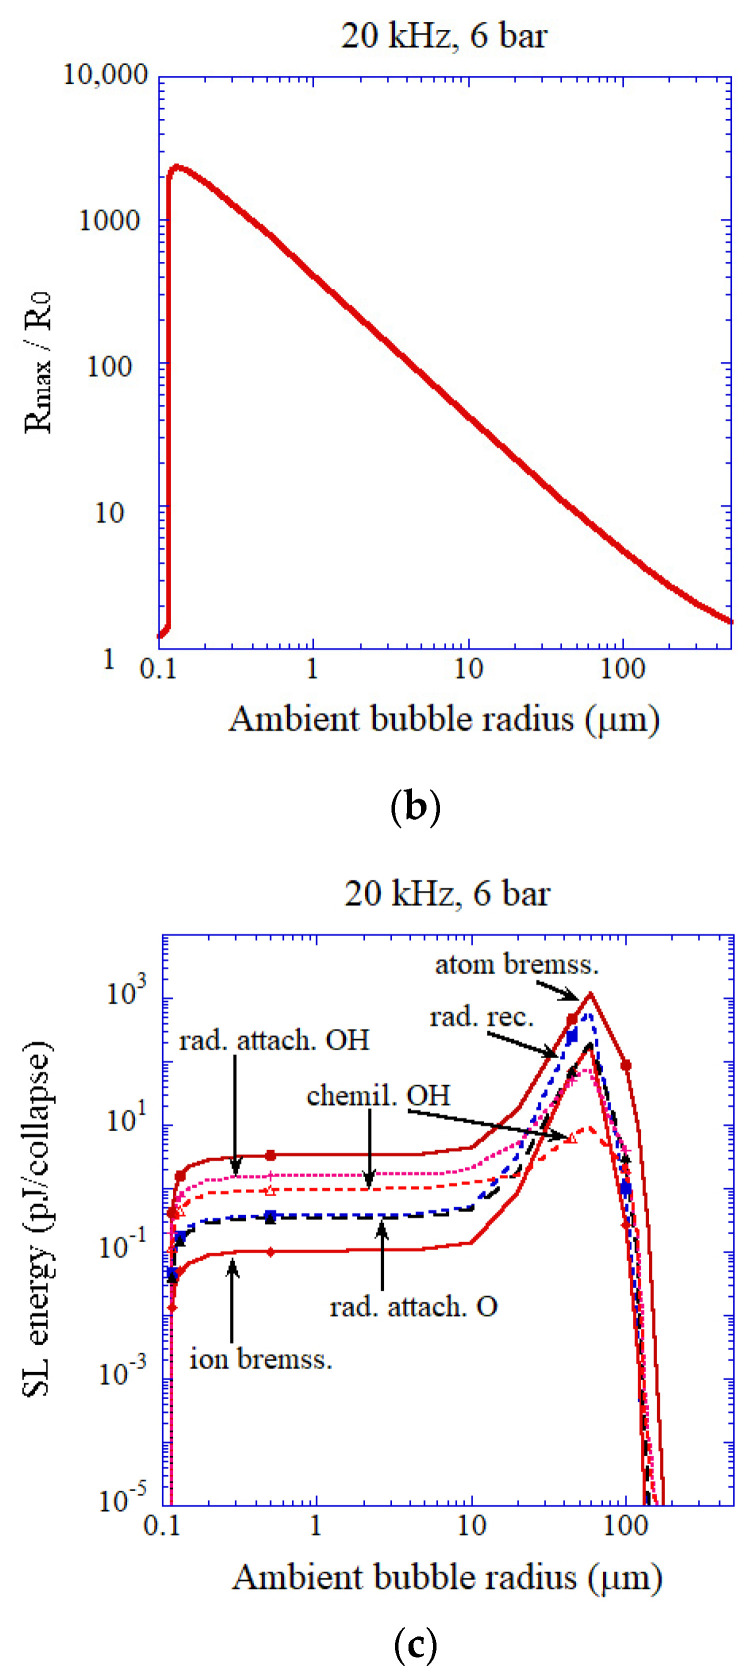
Figure 17.
The calculated results for an air bubble as a function of ambient bubble radius at 20 kHz and 6 bar in ultrasonic frequency and acoustic amplitude, respectively [43]. The horizontal axis is in logarithmic scale. (a) The peak temperature (solid) and the molar fraction of water vapor (dash dotted) inside a bubble at the end of the bubble collapse. (b) The expansion ratio (Rmax/R0). (c) The intensity of each emission process in SL. The vertical axis is in logarithmic scale. Copyright 2008, with the permission of AIP Publishing.


