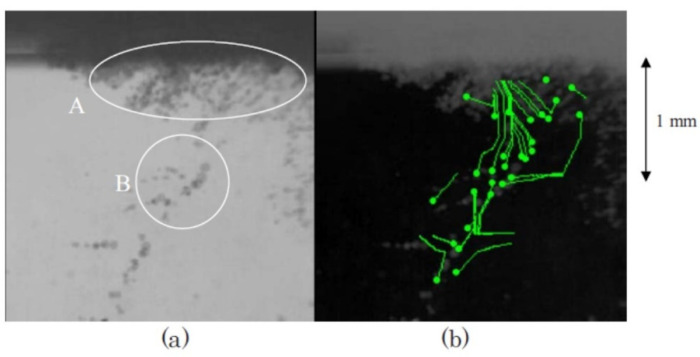
Figure 18.
Cavitation bubbles under an ultrasonic horn at 29 kHz and 5 W observed by a high-speed video camera [19]. The frame (b) is the result of the analysis of the bubble motion. The small circles are the starting points for the analysis and the curves are the calculated streamlines of bubbles. In the frame (a), the bubble clouds A and B are marked by circles. Copyright 2008, with the permission from American Physical Society.

