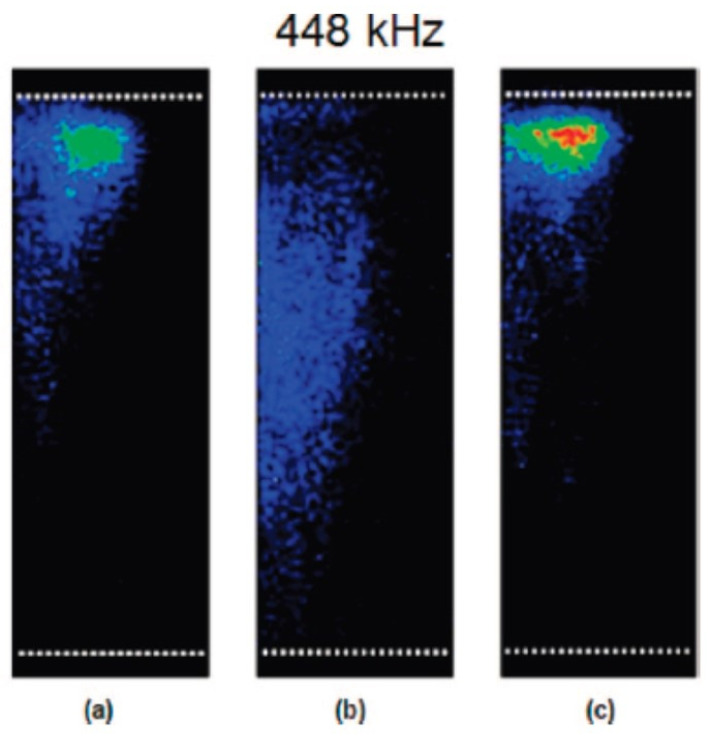
Figure 26.
Images showing the effect of SDS on the MBSL structure generated at a frequency of 448 kHz and at a power of 1.1 W/cm2: (a) water, (b) 1 mM SDS, and (c) 10 mM SDS [59]. Exposure time was set to collect 2 × 10⁵ acoustic cycles. The white dotted lines above and below the MBSL structure denotes the liquid surface and the transducer position, respectively. The center axis of the vessel is located on the left side of the images. Copyright 2008, with the permission from American Chemical Society.

