Figure 1.
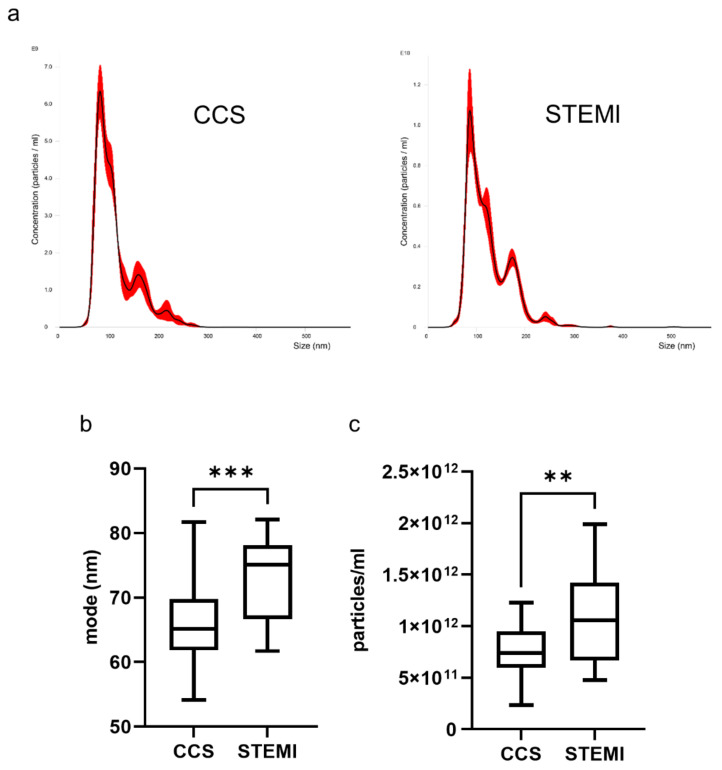
Exosome concentration and dimension are different between CCS and STEMI patients. Exosomes were isolated from plasma of CCS (N = 32) and STEMI (N = 18) patients and analyzed by NTA. (a) Representative NTA traces of exosomes isolated from plasma of CCS and STEMI patients. (b,c) Analysis of exosome dimension (mode) (b) and concentration (number of particles/mL) (c) as assessed by NTA. For each box plot, the center line illustrates the median and box limits indicate the 25th and 75th percentiles. ** p < 0.01, *** p < 0.001.

